Images and videos
Images

ST-elevation myocardial infarction
12-Lead ECG 3 hours later with completed anterolateral infarct, absence of anterolateral R waves, and the development of anterolateral Q waves; the ST segments are returning to normal
From the personal collection of Dr Mahi Ashwath; used with permission
See this image in context in the following section/s:

ST-elevation myocardial infarction
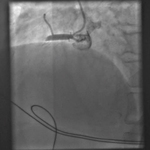
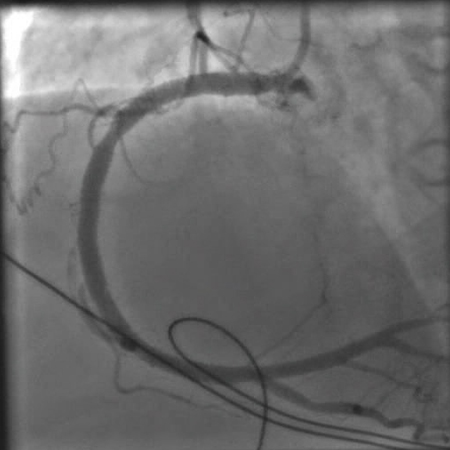
Angiogram showing occluded right coronary artery
From the personal collection of Dr Mahi Ashwath; used with permission
See this image in context in the following section/s:
ST-elevation myocardial infarction
12-Lead ECG the next day with completed anterolateral infarct; ST segments are completely back to baseline
From the personal collection of Dr Mahi Ashwath; used with permission
See this image in context in the following section/s:
ST-elevation myocardial infarction
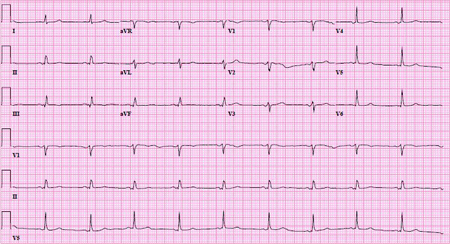
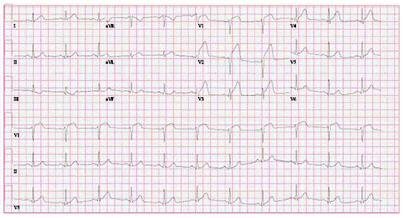
12-Lead ECG on follow-up 7 months later with normal ST segments and the absence of Q waves
From the personal collection of Dr Mahi Ashwath; used with permission
See this image in context in the following section/s:
ST-elevation myocardial infarction
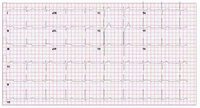
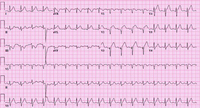
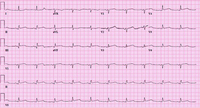
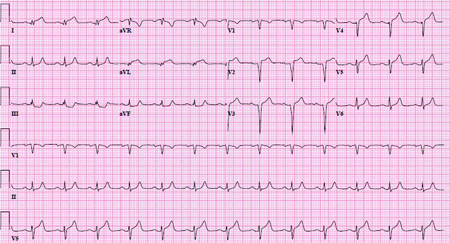
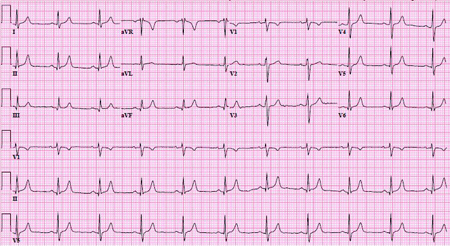
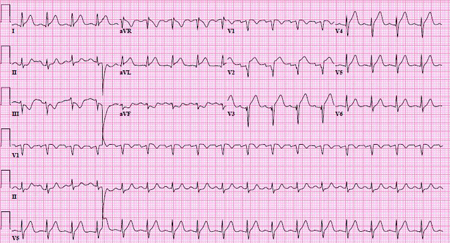
12-Lead ECG with ST-segment elevation in the inferior leads (II, III, and aVF)
From the personal collection of Dr Mahi Ashwath; used with permission
See this image in context in the following section/s:
ST-elevation myocardial infarction
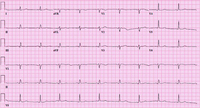
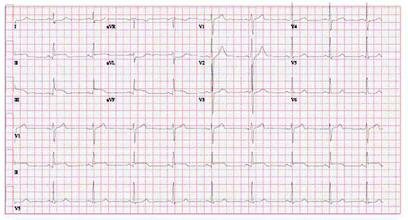
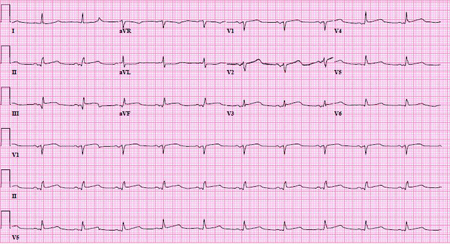
12-Lead ECG with normal ST segments and without any abnormal Q waves
From the personal collection of Dr Mahi Ashwath; used with permission
See this image in context in the following section/s:
ST-elevation myocardial infarction
Angiogram after balloon angioplasty and stenting showing an open right coronary artery
From the personal collection of Dr Mahi Ashwath; used with permission
See this image in context in the following section/s:
ST-elevation myocardial infarction
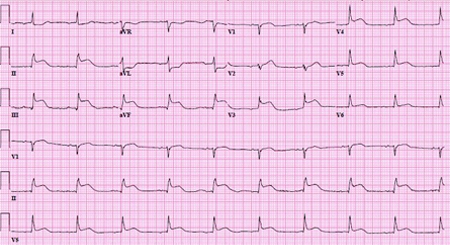
12-Lead ECG 1 week later with borderline anterolateral ST-elevation and reciprocal ST-depression in the inferior leads; also noted is the poor R-wave progression and the presence of septal Q waves
From the personal collection of Dr Mahi Ashwath; used with permission
See this image in context in the following section/s:
ST-elevation myocardial infarction
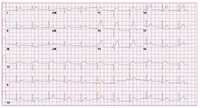
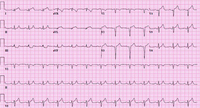
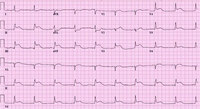
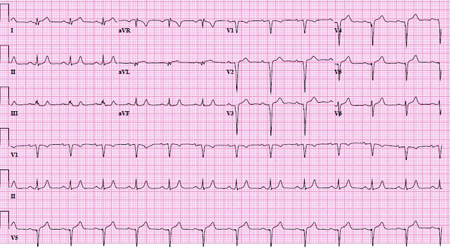
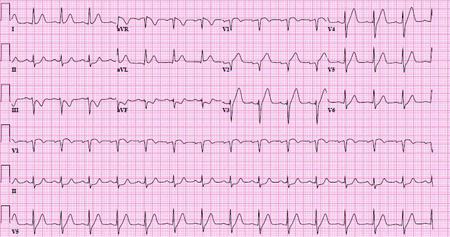
12-Lead ECG showing inferior and anterior ST-elevation with reciprocal changes in the lateral leads
From the personal collection of Dr Mahi Ashwath; used with permission
See this image in context in the following section/s:
ST-elevation myocardial infarction
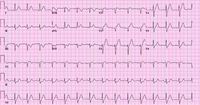
12-Lead ECG 1 hour later with obvious anterolateral ST-elevation and reciprocal ST-depression in the inferior leads, absence of anterior R waves, and the development of anterior Q waves
From the personal collection of Dr Mahi Ashwath; used with permission
See this image in context in the following section/s:
ST-elevation myocardial infarction
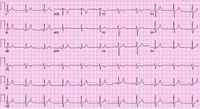
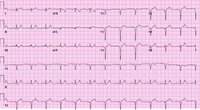
12-Lead ECG with ST-segment elevation lead V1 to V4
From the personal collection of Dr Mahi Ashwath; used with permission
See this image in context in the following section/s:

ST-elevation myocardial infarction
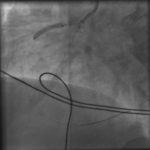
Angiogram showing an attempt to open the occluded right coronary artery with an angioplasty balloon
From the personal collection of Dr Mahi Ashwath; used with permission
See this image in context in the following section/s:
ST-elevation myocardial infarction
12-Lead ECG immediately after successful revascularization showing ST segments returning to baseline
From the personal collection of Dr Mahi Ashwath; used with permission
See this image in context in the following section/s:
Videos
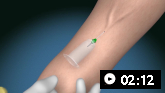 Venepuncture and phlebotomy: animated demonstration
How to take a venous blood sample from the antecubital fossa using a vacuum needle.
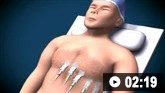 How to perform an ECG: animated demonstration
How to record an ECG. Demonstrates placement of chest and limb electrodes.
Use of this content is subject to our disclaimer