Images and videos
Images
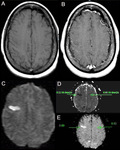

Ischemic stroke
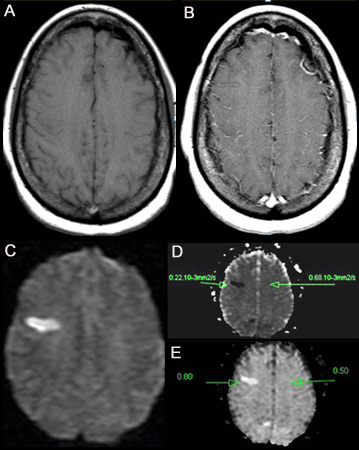
(A) Noncontrast T1-weighted MRI. (B) Post-contrast T1-weighted MRI showing minimal increase in leptomeningeal vessels over the right frontal region. (C) Diffusion-weighted image (DWI) showing a hyperintense area in the right frontal region. (D) Apparent diffusion coefficient (ADC) map shows hypointense lesion, indicating restricted diffusion that correlates with high intensity on DWI and exponential diffusion. (E) ADC value is 0.22 x 10¯³ mm²/second, corresponding to a hyperacute infarct
From the personal collection of Eric E. Smith; used with permission
See this image in context in the following section/s:

Ischemic stroke
Data from DAWN and DEFUSE-3 trials (cerebral blood flow [CBF]; time-to-maximum [Tmax]; internal carotid artery [ICA]; middle cerebral artery [MCA])
Created by BMJ Knowledge Centre using data from Dawn-Nogueira et al. N Engl J Med. 2018 378(1):11-21 and Defuse-Albers et al. N Engl J Med. 2018 22;378(8):708-18
See this image in context in the following section/s:
Ischemic stroke
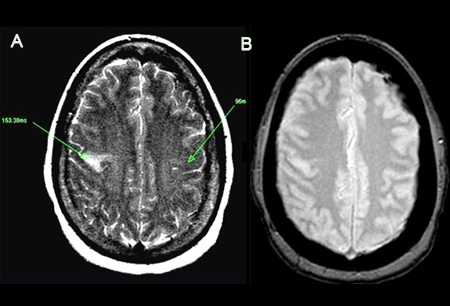
(A) T2-weighted MRI image showing hyperintense signal representing prolonged T2. Shows abnormal T2 of 153.38 ms on the left, compared with the normal contralateral side (96 ms). Note that the lesion is located on the ascending frontal gyrus. (B) Gradient echo images detect hemosiderin compounds due to magnetic susceptibility of iron. In this case the result is negative
From the personal collection of Eric E. Smith; used with permission
See this image in context in the following section/s:
Ischemic stroke
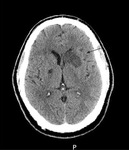
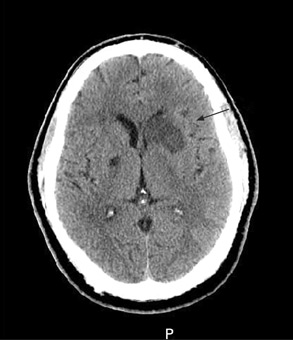
Noncontrast CT scan of brain showing subacute isolated left basal ganglion infarction with left frontal horn mass effect
Courtesy of BMJ Case Reports 2009; doi:10.1136/bcr.10.2008.1139
See this image in context in the following section/s:
Videos
 Tracheal intubation: animated demonstration
How to insert a tracheal tube in an adult using a laryngoscope.
 Bag-valve-mask ventilation: animated demonstration
How to use bag-valve-mask apparatus to deliver ventilatory support to adults. Video demonstrates the two-person technique.
Use of this content is subject to our disclaimer