Images and videos
Images


Evaluation of dyspnea
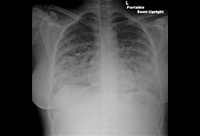
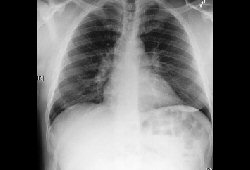
Pericardial tamponade: admission chest x-ray
Usalan C, Atalar E, Vural FK. Pericardial tamponade in a 65-year-old woman. Postgrad Med J. 1999;75:183-184; used with permission.
See this image in context in the following section/s:
Evaluation of dyspnea
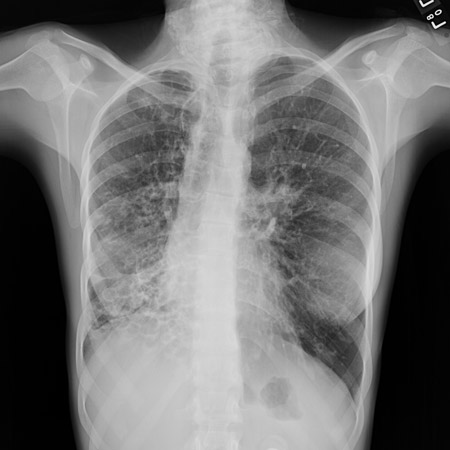
Chest x-ray with lack of normal tapering producing a tram line
From archives of Dr Sangeeta M. Bhorade; used with permission
See this image in context in the following section/s:
Evaluation of dyspnea
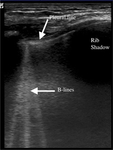
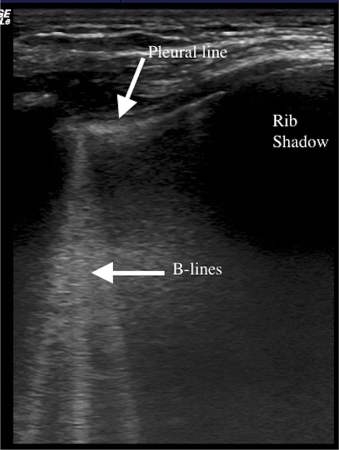
Lung ultrasonography scan of a single intercostal space showing B-lines (white vertical lines) - curved array
Wimalasena Y, Kocierz L, Strong D, et al. Lung ultrasound: a useful tool in the assessment of the dyspnoeic patient in the emergency department. Fact or fiction? Emerg Med J. 2017 Mar 3. pii.
See this image in context in the following section/s:

Evaluation of dyspnea
Original and simplified Wells Criteria (modified)
Created by the BMJ Knowledge Centre
See this image in context in the following section/s:
Evaluation of dyspnea
Original and simplified Geneva score (revised)
Created by the BMJ Knowledge Centre
See this image in context in the following section/s:

Evaluation of dyspnea
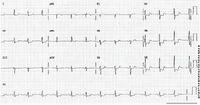
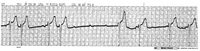
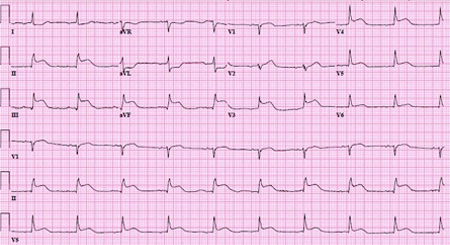
ECG showing complete atrioventricular (AV) block
From the collection of Brian Olshansky, MD, FAHA, FACC, FHRS; used with permission
See this image in context in the following section/s:
Evaluation of dyspnea
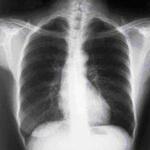
Bilateral hilar adenopathy
From the collection of Dr M.P. Muthiah; used with permission
See this image in context in the following section/s:
Evaluation of dyspnea
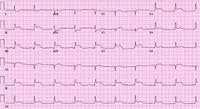
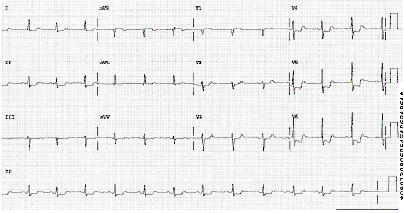
12-Lead ECG showing inferior and anterior ST-elevation with reciprocal changes in the lateral leads
From the personal collection of Dr Mahi Ashwath; used with permission
See this image in context in the following section/s:

Evaluation of dyspnea
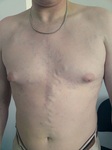
Prominent collateral vein on the anterior chest and abdominal wall in a patient with superior vena cava syndrome.
From the collection of E Kempny. Reproduced under the Creative Commons CC BY-SA 4.0 license (https://creativecommons.org/licenses/by-sa/4.0/)
See this image in context in the following section/s:

Evaluation of dyspnea
Chest CT with dilated and thickened airways and peripheral tree-in-bud pattern
From archives of Dr Sangeeta M. Bhorade; used with permission
See this image in context in the following section/s:
Evaluation of dyspnea
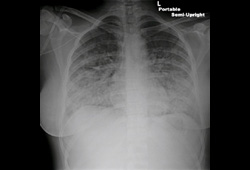
Chest x-ray of acute pulmonary edema showing increased alveolar markings, fluid in the horizontal fissure, and blunting of the costophrenic angles
From the private collections of Syed W. Yusuf, MBBS, MRCPI, and Daniel Lenihan, MD
See this image in context in the following section/s:
Evaluation of dyspnea
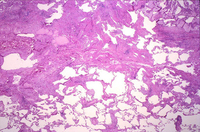
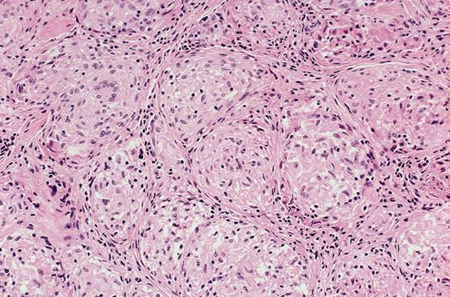
Photomicrograph showing well-formed granulomas typical for sarcoidosis
From the collection of Dr M.P. Muthiah; used with permission
See this image in context in the following section/s:
Evaluation of dyspnea
ECG showing ST depression
From the personal collection of Dr Syed W. Yusuf and Dr Iyad N. Daher, Department of Cardiology, University of Texas, Houston; used with permission
See this image in context in the following section/s:
Evaluation of dyspnea
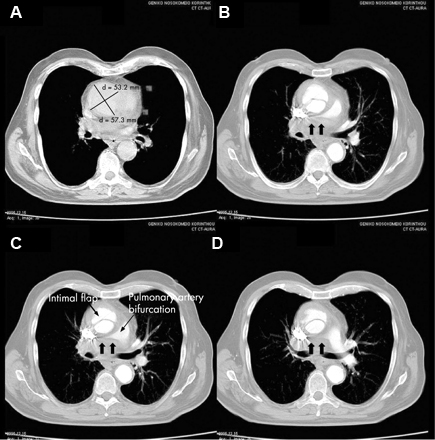
CT of a 71-year-old man showing type II dissecting aneurysm of the ascending aorta. Haematoma around the proximal segment of the ascending aorta (panels A-D) compressed the right pulmonary artery, almost occluding its patency and limiting the perfusion of the reciprocal lung
Stougiannos PN, Mytas DZ, Pyrgakis VN. The changing faces of aortic dissection: an unusual presentation mimicking pulmonary embolism. BMJ Case Reports 2009; doi:10.1136/bcr.2006.104414
See this image in context in the following section/s:
Evaluation of dyspnea
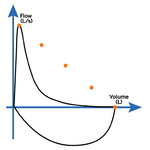
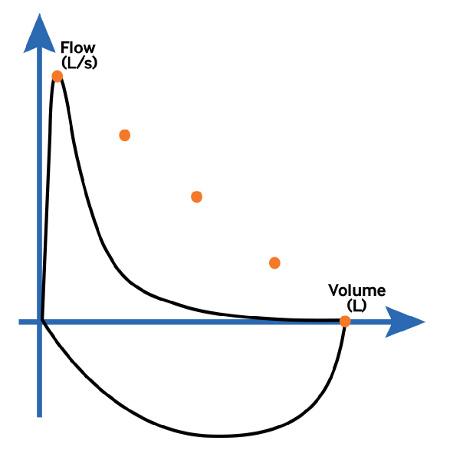
Flow-volume loop (spirogram) in obstructive lung disease, such as asthma or COPD: peak expiratory flow may be normal, but a concave shape is seen following the point of maximal flow due to the low flow rate in relation to lung volume
Spirometry. Interpretation of the flow-volume loop. 2017. https://www.spirometry.guru
See this image in context in the following section/s:
Evaluation of dyspnea
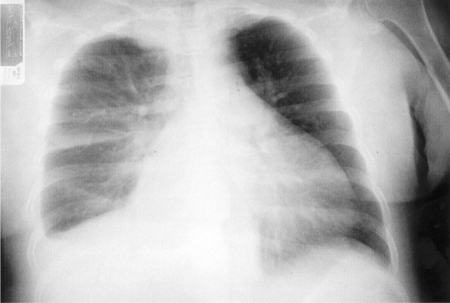
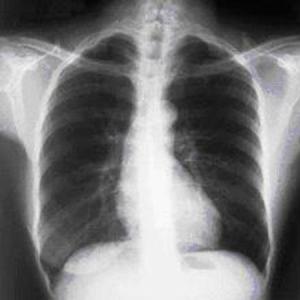
Chest x-ray showing hyperinflation in a patient with COPD. The hyperinflation is caused by the emphysema component of COPD, rather than the chronic bronchitis that underlies symptoms of cough
From the personal collection of Dr M. A. Sharifabadand, SUNY at Stony Brook School of Medicine, Department of Pulmonary and Critical Care Medicine, Mineola, New York and Dr J. P. Parsons, The Ohio State University Medical Center, Columbus; used with permission
See this image in context in the following section/s:
Evaluation of dyspnea
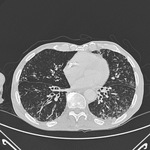
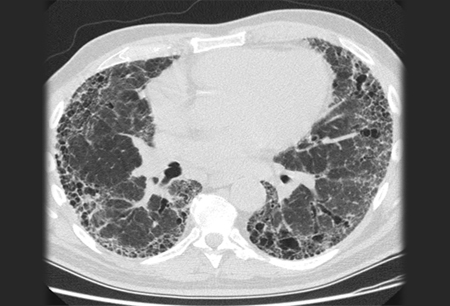
Chest CT scan image of idiopathic pulmonary fibrosis
From the collection of Jeffrey C. Munson, MD, MS; used with permission
See this image in context in the following section/s:

Evaluation of dyspnea
Pathology slide of usual interstitial pneumonia, the characteristic biopsy appearance of a patient with idiopathic pulmonary fibrosis
From the collection of Gregory Tino, MD; used with permission
See this image in context in the following section/s:
Videos
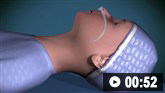 Nasopharyngeal airway: animated demonstration
How to select the correct size naspharyngeal airway and insert the airway device safely.
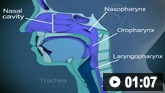 Oropharyngeal airway: animated demonstration
How to size and insert an oropharygeal airway.
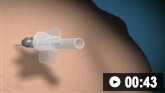 Needle decompression of tension pneumothorax: animated demonstration
How to decompress a tension pneumothorax. Demonstrates insertion of a large-bore intravenous catheter into the fourth intercostal space in an adult.
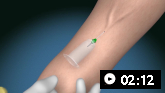 Venepuncture and phlebotomy: animated demonstration
How to take a venous blood sample from the antecubital fossa using a vacuum needle.
 Peak flow measurement: animated demonstration
How to use a peak flow meter to obtain a peak expiratory flow measurement.
 How to perform an ECG: animated demonstration
How to record an ECG. Demonstrates placement of chest and limb electrodes.
 Radial artery puncture animated demonstration
How to obtain an arterial blood sample from the radial artery.
 Femoral artery puncture animated demonstration
How to perform a femoral artery puncture to collect a sample of arterial blood.
Use of this content is subject to our disclaimer