Images and videos
Images


Assessment of memory deficit
Diagnostic algorithm for acute onset memory deficit. 1: changes in signal intensities, structural lesions on brain MRI; 2: sometimes increased signal intensities on diffusion-weighted imaging; EEG, electroencephalogram; MRI, magnetic resonance imaging
Created by Mee-Ohk Kim, MD, PhD and Michael D. Geschwind, MD, PhD; used with permission
See this image in context in the following section/s:
Assessment of memory deficit
Diagnostic algorithm for chronic onset memory deficit; bvFTD, behavioural variant frontotemporal dementia; CBD, corticobasal degeneration; FDG-PET, fluorodeoxyglucose - positron emission tomography; FTD, frontotemporal degeneration; LP, lumbar puncture; PIB-PET, Pittsburgh compound B - positron emission tomography; PNFA, progressive non-fluent aphasia; PSP, progressive supranuclear palsy
Created by Mee-Ohk Kim, MD, PhD and Michael D. Geschwind, MD, PhD; used with permission
See this image in context in the following section/s:
Assessment of memory deficit
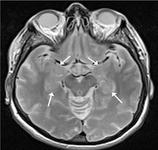
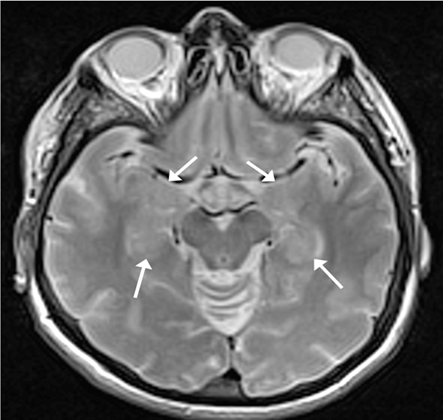
MRI brain (T2 weighted): demonstrates symmetrical hyperintensity of the bilateral medial temporal lobes (hippocampi; outlined by arrows pointing to anterior and middle of hippocampi) consistent with active inflammation in limbic encephalitis and encephalopathy. Note that hippocampi are brighter than other grey matter regions, particularly posterior cortex
From the personal collection of Michael D. Geschwind, MD, PhD; used with permission
See this image in context in the following section/s:

Assessment of memory deficit
Diagnostic algorithm for subacute onset memory deficit. 1: changes in signal intensities, structural lesions on brain MRI; 3: MRI in CJD shows cortical ribboning and/or deep nuclei restricted diffusion on diffusion-weighted imaging/apparent diffusion coefficient map; CSF biomarkers might be elevated; ADC, apparent diffusion coefficient; CJD, Creutzfeldt-Jakob disease; CSF, cerebrospinal fluid; DWI, diffusion-weighted imaging; HSV, herpes simplex virus; MRI, magnetic resonance imaging; NSE, neuron-specific enolase
Created by Mee-Ohk Kim, MD, PhD and Michael D. Geschwind, MD, PhD; used with permission
See this image in context in the following section/s:
Assessment of memory deficit
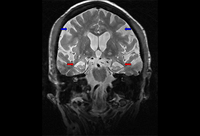
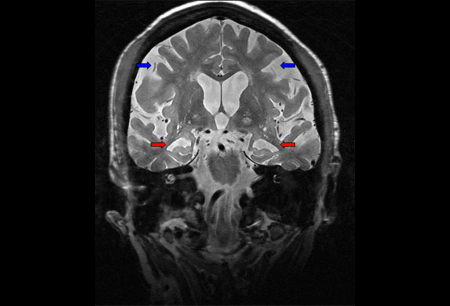
MRI brain: shows diffuse cortical atrophy with predominant hippocampal atrophy (red arrows) in patient with Alzheimer's dementia. Parietal atrophy and neocortical involvement is evident in more advanced disease (blue arrows)
From the personal collection of Michael D. Geschwind, MD, PhD; used with permission
See this image in context in the following section/s:
Use of this content is subject to our disclaimer