Investigations
1st investigations to order
tonometry
Test
The primary method of slowing or halting disease progression is lowering intra-ocular pressure (IOP), so regular measurement at routine ophthalmological examinations is essential. The most common method is Goldmann tonometry. However, this procedure underestimates IOP in patients with thin corneas and overestimates IOP in patients with thick corneas.[12]
IOP measurement alone is not sufficient to determine the presence or absence of glaucoma because patients can have glaucoma with normal IOP. Conversely, patients with IOP above 21 mmHg do not necessarily have glaucoma (but should be considered to be at higher risk).
Result
intra-ocular pressure may be normal or elevated (>21 mmHg)
gonioscopy
Test
Performed during slit-lamp examination. A mirrored lens is placed in contact with the surface of the eye to visualise the anterior chamber angle between the cornea and iris, and to assess fluid drainage. Typically, no obstruction is seen in open-angle glaucoma, differentiating the condition from angle-closure glaucoma, where an obstruction may exist.[1]
By contrast, a narrowing of the space between the peripheral cornea and iris surface exists with angle-closure glaucoma; this feature differentiates the two diseases, except in patients with pseudophakia or synechiae who will have wide angles.[1]
Result
visualisation of anterior chamber and no obstruction of angle
direct ophthalmoscopy
Test
Shines and reflects light onto the eye interior to provide a clear view of the retina and optic disc, with high magnification.
Changes to the rim that are detected (e.g., localised rim loss [notch], diffuse or concentric rim loss, larger cup-to-disc ratio) should be noted.
Can determine the presence of flame haemorrhages around the optic disc, found in late disease.
Result
visualisation of optic disc and retina quality; rim loss might reflect itself in a larger cup-to-disc ratio; flame haemorrhages
indirect ophthalmoscopy
Test
Portable device providing a three-dimensional appearance of the retina and diagnostic optic disc cupping or indentation.
Reflections from the retina at the superior and inferior poles of the optic disc are usually bright in healthy eyes, but are quite dull in glaucoma.[13]
Result
cup-to-disc ratio >0.5 may be suspicious of glaucoma as is asymmetry of greater than 0.2 between the two eyes; three-dimensional view of retina and optic disc cupping
slit-lamp biomicroscopy
Test
Allows for assessment of the cornea, anterior chamber, and drainage angle. Intra-ocular pressure can also be measured. Fundal examination, looking at the optic disc, can also be facilitated using the slit lamp.
The most frequent method of retinal and optic disc visualisation used by ophthalmologists.
Result
cornea should be clear, anterior chamber should be deep, and drainage angle should be open
visual field testing
Test
If glaucoma is suspected, an automated visual field test should be performed.[12][33]
Glaucoma defects typically start horizontally, with defects that split down the vertical midline suggesting central defects in the brain or posterior visual pathway.
Scotomas with either an elevated intra-ocular pressure or an enlarged cup-to-disc ratio have high sensitivity and specificity.
First-time test takers often perform worse than those on subsequent examination.
The patient's alertness influences results; therefore, new scotomas are always confirmed by repeating the test on a different day.
By the time of disease detection, 50% of the nerve fibre layer may be damaged.[43][44]
Despite widespread use, confrontation visual fields can easily miss subtle damage.
Result
scotomas indicating loss of the nerve fibre layer
optical coherence tomography scanning
Test
Digital imaging of the optic nerve head, retinal nerve fibre layer, and macula are documented at baseline and follow-up, providing quantitative information of change that supplements clinical findings.[8][13][33]
OCT is currently the most commonly used imaging modality for this purpose.[8][13][33] It can demonstrate structural alterations in the optic nerve head, the macula, and the parapapillary retinal nerve fibre layer before functional change occurs. Digital images are generated that can be used for several calculations.
OCT is needed to analyse and monitor the thickness of the nerve fibre layer. Thicker tissue is healthier tissue. Serial scans provide a record of changes that can be compared to monitor progression.
Result
change from the first scan; thin nerve fibre layer; loss of nerve fibre layer over time
Investigations to consider
digital imaging
Test
Digital image of the optic nerve head should be taken if glaucoma is suspected.[12] A high-quality image allows detailed comparison with the ophthalmological examination.
Documenting an increase in cup-to-disc ratio is more meaningful than a cup-to-disc ratio determined at a single visit.[1][39][40] For example, large optic nerve heads associated with myopia may have prominent cupping and still be normal, while hypoplastic optic nerve heads may have significant damage but retain small cups.
Images of the optic nerve head can also show changes to the nerve rim (e.g., localised rim loss [notch], diffuse or concentric rim loss, larger cup-to-disc ratio). Images are repeated and compared each time a clinical change is detected.[Figure caption and citation for the preceding image starts]: Fundus photograph of normal optic nerve headCollection of Robert B. Avery, MD, PhD [Citation ends]. [Figure caption and citation for the preceding image starts]: Photograph showing optic disc cupping. An increase in cup-to-disc ratio over time may indicate glaucoma.Collection of Robert B. Avery, MD, PhD [Citation ends].
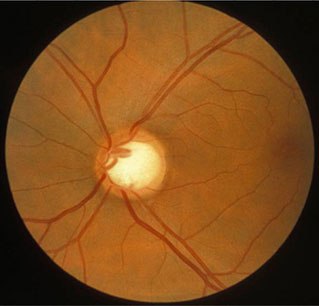
Digital imaging may help distinguish between glaucomatous and non-glaucomatous nerve fibre thinning based on the presence or absence of progression.
Result
an absolute cup-to-disc ratio >0.5 is usually suggestive but is less useful than an increasing cup-to-disc ratio over time (e.g., a ratio of 0.7 may be a normal anatomical variant, while a ratio of 0.3 may indicate glaucoma if it started at a ratio of 0.1)
pachymetry
Test
Pachymetry provides measurement of corneal thickness. Can be performed by optical coherence tomography.
Thin central corneal thickness is associated with a higher rate of progression from ocular hypertension to glaucoma and a higher risk of glaucoma progression.[29] A thick cornea can falsely increase the intra-ocular pressure (IOP) reading. A thin central corneal thickness can provide a misleadingly low value for the IOP.[38]
Result
thin central corneal thickness can predict progression from high intra-ocular pressure to glaucoma
nerve fibre layer analysis
Test
Performed by optical coherence tomography, scanning laser polarimetry, or confocal scanning laser ophthalmoscopy.
Shows loss of the nerve fibre layer compared with the known standards of the scanning device.
Sensitivity and specificity are high in the context of other signs.
Result
loss of nerve fibre layer
Emerging tests
corneal hysteresis
Test
Corneal hysteresis refers to the corneal response to transient compression and release by an air-puff tonometer (i.e., the difference between the initial and rebound applanation pressure). Values may be lower in glaucoma, and lower values may be associated with an increased risk of glaucoma progression.[29]
Interpretation can be affected by other host factors (e.g., surgery, age, axial length, intra-ocular pressure). Where measurement is possible, corneal hysteresis can be used to complement other structural and functional assessments for both the risk of glaucoma and the risk of progression (lower values indicate increased risk). Refer to product literature for reference values.[29][45]
Result
lower values observed in those at risk of diagnosis or progression
Use of this content is subject to our disclaimer