Images and videos
Images


Frailty
Kaplan-Meier plot showing differences in mortality. The figure shows mortality (age and gender adjusted) in frail and non-frail individuals. Mean time at risk was 262.3 days, median 238 days
Hoffmann S et al. BMJ Open 2020 Oct 28;10(10):e038768; used with permission
See this image in context in the following section/s:
Frailty
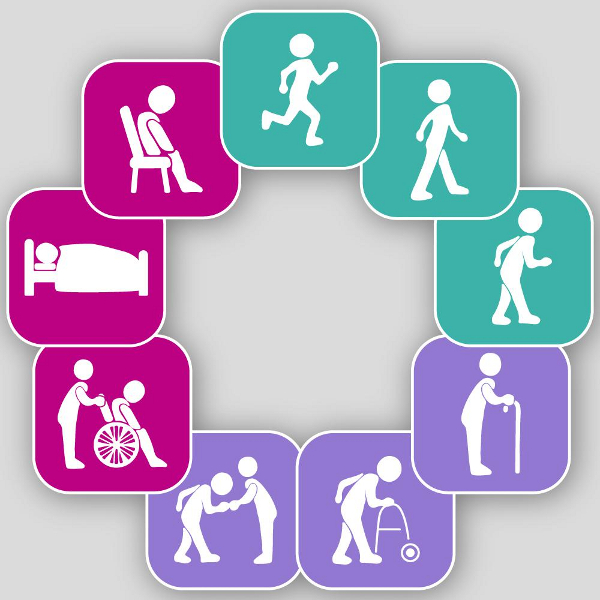
Clinical Frailty Scale
Adapted from Dalhousie University. Clinical Frailty Scale version 2.0. 2020; used with permission
See this image in context in the following section/s:

Frailty
Sit up, get dressed, Keep moving
British Geriatrics Society. ‘Sit Up, Get Dressed and Keep Moving!’. Jul 2020 [internet publication] [https://www.bgs.org.uk]; used with permission
See this image in context in the following section/s:

Frailty
Vulnerability of frail older people to a sudden change in health status following a minor illness. The green line represents a fit older person who, following a minor stress such as an infection, experiences a relatively small deterioration in function and then returns to homeostasis. The red line represents a frail older person who, following a similar stress, experiences a larger deterioration which may manifest as functional dependency and who does not return to baseline homeostasis
Clegg A et al. Lancet 2013 Mar 2;381(9868):752-62; used with permission
See this image in context in the following section/s:

Frailty
Health benefits of physical activity
NHS RightCare. Falls and Fragility Fractures Pathway. Nov 2017 [internet publication] [https://www.england.nhs.uk/rightcare]; used with permission
See this image in context in the following section/s:
Frailty
Medications that may need to be stopped (adapted from BMJ Learning module on frailty)
Created by BMJ Learning; used with permission
See this image in context in the following section/s:
Frailty
Venn diagram displaying the overlap in prevalence (%) between frailty, multimorbidity and disability
Adapted from Aarts S et al. J Frailty Aging 2015;4(3):131-8; used with permission
See this image in context in the following section/s:

Frailty
Cascade of functional decline from independence through frailty to disability
Dent, E et al. J Nutr Health Aging 23, 771–87 (2019) [based on concepts and findings from other studies]; used with permission
See this image in context in the following section/s:
Frailty
Integration of care services over a life course (FA: functional ability, IC: intrinsic capacity)
Cesari M et al. BMJ Global Health 2022;7:e007778; used with permission
See this image in context in the following section/s:
Frailty
British Geriatrics Society Comprehensive Geriatric Assessment (CGA)
British Geriatrics Society. Comprehensive Geriatric Assessment Toolkit for Primary Care Practitioners. Jan 2019 [internet publication] [https://www.bgs.org.uk]; used with permission
See this image in context in the following section/s:
Frailty
Stages of living with frailty
Created by BMJ Knowledge Centre
See this image in context in the following section/s:
Frailty
Department of health guidance on physical activity for adults and older adults: 19 and over
Department of Health and Social Care, 2019. Physical activity for adults and older adults: 19 and over; used with permission
See this image in context in the following section/s:
Frailty
PRISMA-7. Yes-answers are given one point each; No-answers are given zero points. A score of three or above indicates frailty
Hoffmann S et al. BMJ Open 2020;10:e038768; used with permission
See this image in context in the following section/s:

Frailty
The frailty cycle; VO2 = volume of oxygen utilisation
Adapted from Fried L et al. Frailty and failure to thrive. Principles of geriatric medicine and gerontology 2003 5th edn. New York: McGraw-Hill; used with permission
See this image in context in the following section/s:
Frailty
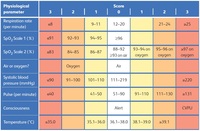
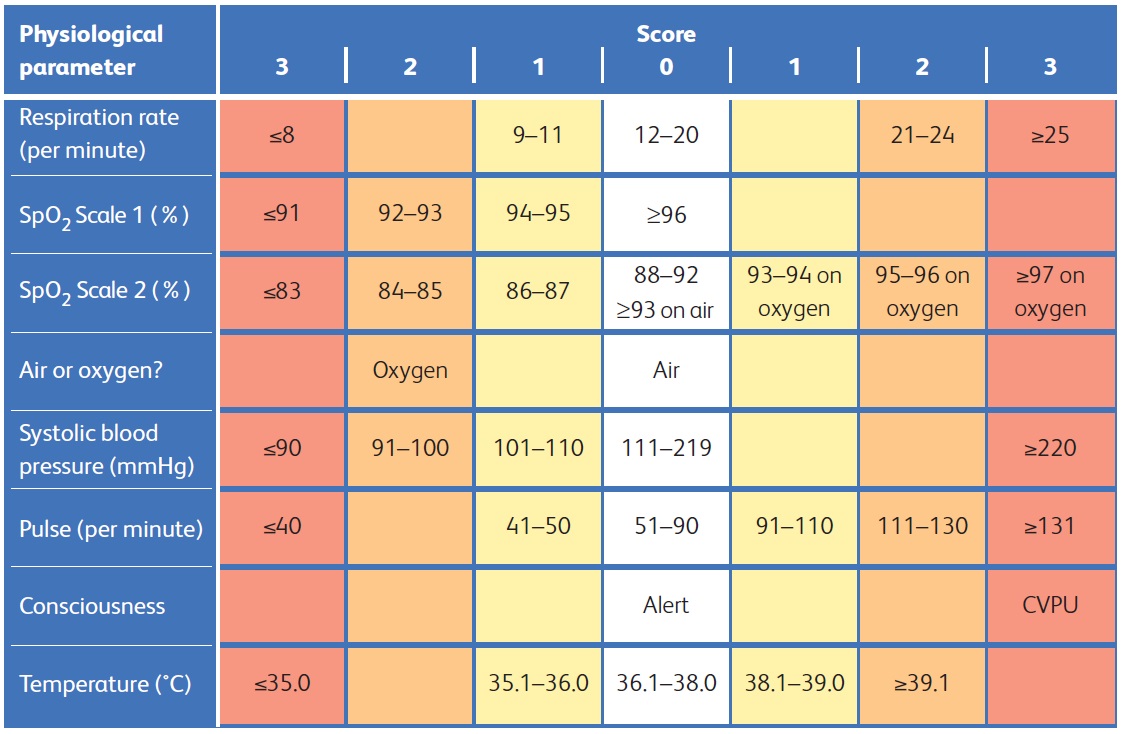
National Early Warning Score 2 (NEWS2) is an early warning score produced by the Royal College of Physicians in the UK. It is based on the assessment of six individual parameters, which are assigned a score of between 0 and 3: respiratory rate, oxygen saturations, temperature, blood pressure, heart rate, and level of consciousness. There are different scales for oxygen saturation levels based on a patient’s physiological target (with scale 2 being used for patients at risk of hypercapnic respiratory failure). The score is then aggregated to give a final total score; the higher the score, the higher the risk of clinical deterioration
Reproduced from: Royal College of Physicians. National Early Warning Score (NEWS) 2: Standardising the assessment of acute-illness severity in the NHS. Updated report of a working party. London: RCP, 2017.
See this image in context in the following section/s:

Frailty
Example of a ReSPECT form
Resuscitation Council UK: ReSPECT for healthcare professionals; used with permission
See this image in context in the following section/s:
Videos
 Assessing older patients - history
Video showing an example of taking a medical history.
 Why is it important to identify frailty?
Video on the importance of identifying people living with frailty in the community.
 How to identify and assess frailty
Video outlining how to identify and assess people living with frailty
 Functional assessment of an older adult
Video illustrating how to conduct a functional assessment of someone living with frailty in their own home environment.
Use of this content is subject to our disclaimer