Images and videos
Images


Brugada syndrome
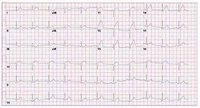
Electrocardiographic patterns in Brugada syndrome showing type 1 (diagnostic) and types 2 and 3 (non-diagnostic) patterns. Type-1 (diagnostic): coved STT morphology in lead V2 with J-point elevation (dark gray line) of ≥0.2 mV (≥2 mm) and a terminal ST-segment elevation (light gray line, J+60 ms) also ≥0.2 mV (≥2 mm). Note the PR interval and wider QRS complex, wide and deep S in lead I, and fractionation in the right precordial ECG leads. Type-2 (non-diagnostic): saddleback STT morphology in lead V2 with J-point elevation (dark gray line) of ≥0.2 mV (≥2 mm) and a terminal ST-segment elevation (light gray line, J+60 ms) ≥0.1 mV (≥1 mm), followed by a positive T wave. Note the less wide and deep S-wave in lead I, less prominent fractionation. Type-3 (non-diagnostic): saddleback STT morphology in lead V2 with J-point elevation (dark gray line) of ≥0.2 mV (≥2 mm) and a terminal ST-segment elevation (light gray line, J+60 ms) <0.1 mV (<1 mm)
Marsman EMJ et al. Heart 2022 May;108(9):668-75; used with permission
See this image in context in the following section/s:
Brugada syndrome
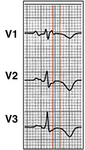
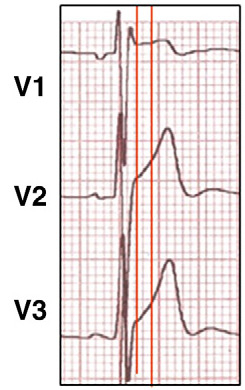
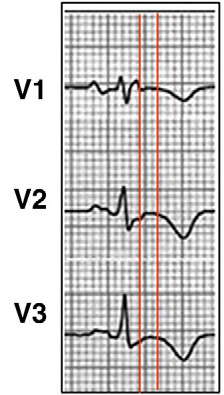
3-lead ECG showing findings suggestive of pectus excavatum
Bayés de Luna A et al. J Electrocardiol. 2012 Sep;45(5):433-42; used with permission
See this image in context in the following section/s:
Brugada syndrome
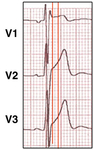
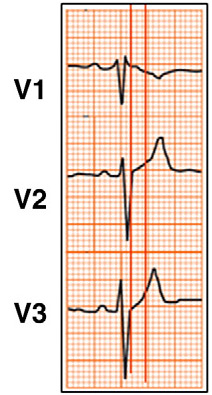
3-lead ECG showing right bundle branch block
Bayés de Luna A et al. J Electrocardiol. 2012 Sep;45(5):433-42; used with permission
See this image in context in the following section/s:

Brugada syndrome
Standard- and high-lead electrocardiogram positions. (Top) Standard-lead ECG positions and corresponding precordial ECG in a patient with Brugada syndrome. (Bottom) High-lead ECG positions and corresponding ECG in the same patient. Note that hV5 and hV6 on the high-lead ECG correspond with V1 and V2 on the standard-lead ECG.
Krahn AD, et al. Brugada syndrome. JACC Clin Electrophysiol 2022 Mar;8(3):386-405; used with permission
See this image in context in the following section/s:
Brugada syndrome
Management summary for Brugada syndrome
Adapted from Krahn AD et al. J Am Coll Cardiol EP. 2022 Mar, 8 (3) 386-405; used with permission
See this image in context in the following section/s:

Brugada syndrome
Cardiac action potential in Brugada syndrome. Blue line indicates normal ventricular action potential; red line indicates delayed upstroke of action potential in Brugada syndrome. Action potential phases: 0, rapid depolarization; 1, rapid/early repolarization; 2, plateau; 3, terminal repolarization; 4, resting potential
Krahn AD et al. JACC Clin Electrophysiol 2022 Mar;8(3):386-405; used with permission
See this image in context in the following section/s:
Brugada syndrome
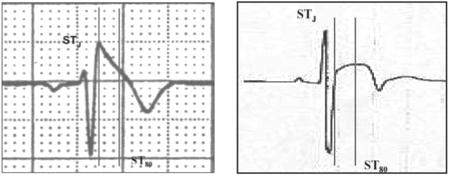
Brugada type 1 ECG (left) in comparison to early repolarization with "convex" ST segment elevation in a trained athlete (right). [Vertical lines mark the J-point (STJ) and 80 ms after the J-point (ST80). The "downsloping" ST segment elevation in Brugada pattern has an STJ/ST80 ratio >1. Early repolarization patterns in the athlete shows an initial "upsloping" ST segment elevation with STJ/ST80 ratio <1].
Drezner JA et al. Br J Sports Med 2017 May;51(9):704-31; used with permission
See this image in context in the following section/s:
Brugada syndrome
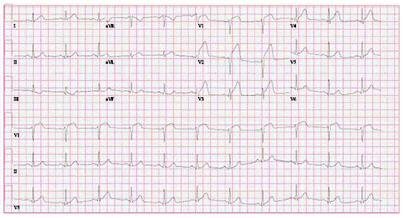
12-lead ECG demonstrating prominent U-waves in a patient with hypokalemia
From: Lin HW, Chau T, Lin CS, Lin SH, Recurring paralysis, BMJ Case Reports 2009; doi:10.1136/bcr.07.2008.0577
See this image in context in the following section/s:
Brugada syndrome
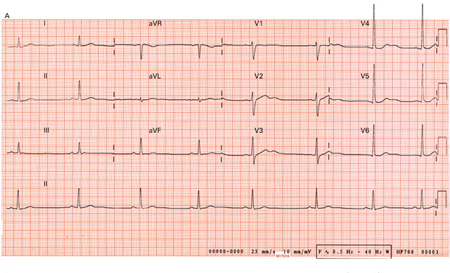
12-Lead ECG with ST-segment elevation lead V1 to V4
From the personal collection of Dr Mahi Ashwath; used with permission
See this image in context in the following section/s:
Brugada syndrome
3-lead ECG showing findings suggestive of arrhythmogenic right ventricular cardiomyopathy
Bayés de Luna A et al. J Electrocardiol. 2012 Sep;45(5):433-42; used with permission
See this image in context in the following section/s:

Brugada syndrome
Diagnosis summary for Brugada syndrome [IMAGE KEY: EP = Electrophysiology; ICD = Implantable cardioverter defibrillator; ICS = Intercostal space; MRI = Magnetic resonance imaging; SCB = Sodium-channel blocker]
Krahn AD, et al. Brugada syndrome. JACC Clin Electrophysiol 2022 Mar;8(3):386-405; used with permission
See this image in context in the following section/s:
Brugada syndrome
Proposed Shanghai Score for diagnosis of Brugada syndrome
Adapted from Peltenburg PJ et al. Neth Heart J. 31. 10.1007/s12471-022-01723-6; used with permission
See this image in context in the following section/s:
Use of this content is subject to our disclaimer