Images and videos
Images
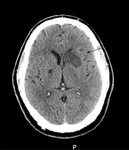


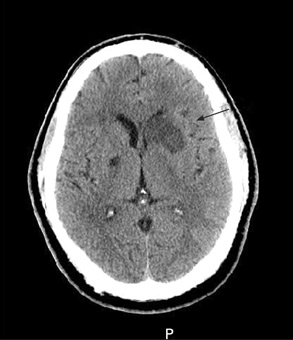
Ischaemic stroke
Non-contrast CT scan of brain showing sub-acute isolated left basal ganglion infarction with left frontal horn mass effect
Courtesy of BMJ Case Reports 2009; doi:10.1136/bcr.10.2008.1139
See this image in context in the following section/s:
Ischaemic stroke
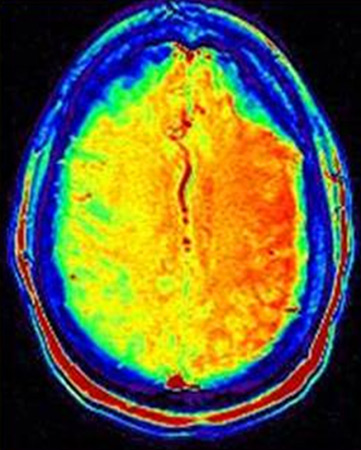
MRI arterial spin labelling image showing extensive hypoperfusion in the right cerebral hemisphere. There is a clear mismatch between diffusion and perfusion
From the personal collection of Eric E. Smith; used with permission
See this image in context in the following section/s:
Ischaemic stroke
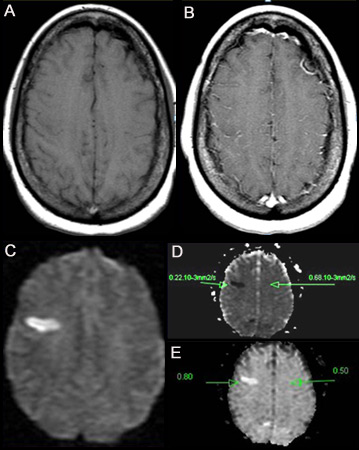
(A) Non-contrast T1-weighted MRI. (B) Post-contrast T1-weighted MRI showing minimal increase in leptomeningeal vessels over the right frontal region. (C) Diffusion-weighted image (DWI) showing a hyperintense area in the right frontal region. (D) Apparent diffusion coefficient (ADC) map shows hypointense lesion, indicating restricted diffusion that correlates with high intensity on DWI and exponential diffusion. (E) ADC value is 0.22 x 10³ mm²/second, corresponding to a hyperacute infarct
From the personal collection of Eric E. Smith; used with permission
See this image in context in the following section/s:
Videos
 Tracheal intubation animated demonstration
How to insert a tracheal tube in an adult using a laryngoscope.
 Bag-valve-mask ventilation animated demonstration
How to use bag-valve-mask apparatus to deliver ventilatory support to adults. Video demonstrates the two-person technique.
Use of this content is subject to our disclaimer