Article Text

Abstract
Background Reliable diagnosis of severe symptomatic aortic stenosis (AS), usually assessed with echocardiography, is important to ensure timely intervention. Degenerative AS is associated with fibrocalcific degeneration of the valve cusps, which can be visualised using computed tomography (CT). Computed tomographic aortic valve calcium scoring (CT-AVC) has emerged as a marker of severe AS, and guidelines now provide thresholds for this diagnosis. However, published CT-AVC thresholds vary in the primary literature. We therefore aimed to assess the performance of CT-AVC as a discriminative test for severe AS in a local population of patients with AS.
Methods We performed a single-centre retrospective review of all patients undergoing CT as part of transcatheter aortic valve implantation (TAVI) assessment between 1st October 2021 and 30th September 2023. All patients who underwent a TAVI-CT with a measured CT-AVC Agatston score within 120 days of an echocardiogram providing a concordant assessment of AS severity (i.e. for severe AS, both aortic valve maximum velocity [AV-Vmax] >4 m/s and aortic valve area [AVA] <1 cm2; for non-severe AS, both AV-Vmax <4 m/s and AVA >1 cm2) were included. Patients with discordant echocardiographic AS severity, bicuspid aortic valve, prosthetic valves, or isolated aortic regurgitation, were excluded. Baseline demographic data, CT-AVC, and echocardiographic measurements from the closest study were collected. Guideline-recommended CT-AVC thresholds of 2000 Agatston units (AU) for males and 1200 AU for females were used for calculations of CT-AVC performance for diagnosis of severe AS (sensitivity, specificity, positive predictive value [PPV], negative predictive value [NPV]). Sex-specific receiver-operator characteristic curves were generated to determine the optimal CT-AVC score threshold for severe AS diagnosis.
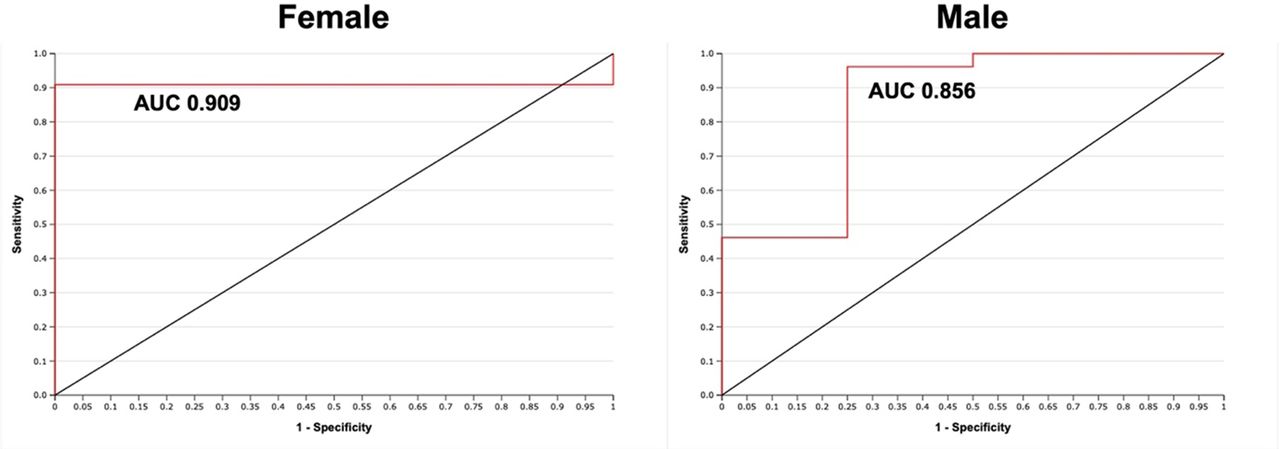
Results 53 cases were identified (table 1). The majority (91%) had severe or greater AS. In males, CT-AVC >2000 AU had a sensitivity of 0.96 and specificity of 0.50 for severe AS, with a PPV of 0.93 and a NPV of 0.67. In females, CT-AVC >1200 AU had a sensitivity of 0.73 and specificity of 1.0 for severe AS, with a PPV of 1.0 and an NPV of 0.14. The optimal CT-AVC thresholds for severe AS were >886 AU in females (sensitivity 0.91, specificity 1.0) and >1836 AU in males (sensitivity 0.96, specificity 0.75). The overall c-statistic for CT-AVC in diagnosing severe AS was 0.91 in females and 0.86 in males (figure 1).
Conclusion Although we demonstrate that CT-AVC appears to perform well in diagnosing severe AS, we report that the optimal thresholds in our population appear to be lower compared to those in the literature. If this were true, then CT-AVC using current guideline thresholds could lead to under-diagnosis of severe AS. Further studies investigating this, and factors predicting variation in CT-AVC with varying degrees of AS (including subgroups where different thresholds may be appropriate), are needed.
Characteristics of the study population, grouped by gender. CT-AVC, computed tomographic aortic valve calcium; LVEF, left ventricular ejection fraction; LVSF; left ventricular systolic function; SD, standard deviation.

Receiver operator characteristic curves (red lines) for females and males assessing the accuracy of computed tomographic aortic valve calcium scoring in diagnosis of aortic stenosis severity when compared against echocardiography. AUC, area under the curve
Conflict of Interest None