Article Text

Abstract
Background: The relationship between inflammation and joint destruction in rheumatoid arthritis (RA) has not been unequivocally characterised. Joint destruction may result from the cumulative inflammatory burden over time, modified by an individual constant factor.
Objective: To test the hypothesis that the relationship between radiological progression and inflammation can mathematically be expressed as:

where ℜ is a factor that varies from person to person.
Methods: Clinical data and radiographs of 76 patients with early RA receiving different disease modifying antirheumatic drugs were analysed. Radiographs were quantified using the modified Larsen score and the “X-Ray RheumaCoach” software. The cumulative inflammatory burden was estimated by the time integrated 28 joint Disease Activity Score (DAS28), calculated as the area under the curve.
Results: 76 patients with early RA who started treatment with methotrexate (n = 20), sulfasalazine (n = 37), or oral gold (n = 19) monotherapy were evaluated. The mean (SEM) DAS28 decreased from 4.6 (0.1) at baseline to 2.3 (0.1) after 2 years. The mean (SEM) ΔLarsen score from baseline to year 2 was 10.3 (1.5). Correlation between cumulative inflammation and radiographic change was poor. In contrast, when calculating a person’s factor ℜ in year 1 (ℜ1) and year 2 (ℜ2), a strong and significant correlation (r = 0.58, p<0.000001) was seen between ℜ1 and ℜ2.
Conclusions: Joint destruction is the result of the cumulative burden of inflammation over time, modified by an individual factor ℜ that remains relatively constant over the first 2 years of observation. The data support a mathematical model that expresses the interrelationship between inflammation and joint destruction.
- ACR, American College of Rheumatology
- AUC, area under the curve
- AUR, aural gold
- CRP, C reactive protein
- DAS28, 28 joint Disease Activity Score
- DMARDs, disease modifying antirheumatic drugs
- ESR, erythrocyte sedimentation rate
- HAQ, Health Assessment Questionnaire
- MTX, methotrexate
- RA, rheumatoid arthritis
- SJC, swollen joint count
- SSZ, sulfasalazine
- TJC, tender joint count
- inflammation
- early rheumatoid arthritis
- joint destruction
Statistics from Altmetric.com
- ACR, American College of Rheumatology
- AUC, area under the curve
- AUR, aural gold
- CRP, C reactive protein
- DAS28, 28 joint Disease Activity Score
- DMARDs, disease modifying antirheumatic drugs
- ESR, erythrocyte sedimentation rate
- HAQ, Health Assessment Questionnaire
- MTX, methotrexate
- RA, rheumatoid arthritis
- SJC, swollen joint count
- SSZ, sulfasalazine
- TJC, tender joint count
Rheumatoid arthritis (RA) is a common systemic disease characterised by chronic polyarticular synovial inflammation and progressive erosion of cartilage and subchondral bone.1 The aetiology and pathophysiological mechanisms of RA have been elucidated only partially, and effective treatment for all patients has yet to be achieved. The progressive inflammatory joint damage is not only painful, often leading to a severe reduction in the quality of life, but can also cause disability and premature death.2
Disease modifying antirheumatic drugs (DMARDs) can reduce the clinical signs and symptoms as well as the acute phase response. If efficacious, the clinical benefit of DMARD treatment becomes apparent within a few weeks or months.3 Radiological changes of RA yield important information beyond that obtained from other variables, such as tender and swollen joint counts, and correlate well with functional outcome.4 The scoring methods of Larsen5 and Sharp6 (including their special modifications) provide similar results and represent the most widely used and appropriate x ray quantification methods available.
The progression of joint damage in RA is unpredictable, showing a slow or stable course in some patients and rapid progression in others. Longitudinal clinical studies have shown that radiographic changes sometimes continue to accrue despite effective suppression of acute phase reactants and clinical signs by DMARD treatment.7,8 Other studies have shown that even patients who did not meet clinical response criteria while receiving treatment with the tumour necrosis factor α blocker infliximab still showed attenuated radiological progression, although methodological considerations may modify this apparent paradox.3 Therefore, it has been suggested that inflammation and joint destruction may not be as completely co-dependent as originally believed. Despite these observations, it stands to reason that inflammation and radiological joint destruction are not completely independent.
Van Leeuwen et al analysed radiological progression, using van der Heijde’s modification of the Sharp score, in relationship to various clinical measures, in a cohort of patients with early RA.9 A significant correlation was found between time integrated C reactive protein (CRP) and radiological progression during the first 3 years of disease. Correlations between radiological progression and other clinical parameters of disease activity were weaker. In subsequent work, van Leeuwen et al derived a sophisticated mathematical model to describe the relationship between time integrated CRP and radiological progression in each patient.10 They showed that, when this relationship was used, accurate prediction of radiological progression is possible.
This study aimed at further characterising the relationship between inflammation and joint destruction in patients with early RA and at testing the hypothesis that the relationship between radiological progression and overall disease activity can also be expressed by a simple mathematical model.
PATIENTS AND METHODS
The Swedish Rheumatoid Arthritis Registry (SRAR) provides prospectively collected clinical data on patients with RA, according to American College of Rheumatology (ACR) criteria, who are diagnosed within 2 years of symptom onset. The SRAR is a collaborative effort of many Swedish rheumatology units, but the data in this paper are based on patients with early RA treated at the Karolinska Hospital only. To be eligible for this study, patients followed up at our unit were included if DMARD treatment was introduced within 2 months after the first visit to our outpatient clinic, at least 2 years of follow up were documented with laboratory and clinical values determined at baseline, 3, 6, 9, 12, 18, and 24 months, and at least three sets of radiographs of hands and feet were taken at baseline and at least at 1 year intervals. In this study we analysed patient groups treated with one of the following DMARDs: oral gold (AUR, n = 19), methotrexate (MTX, n = 20), and sulfasalazine (SSZ, n = 37). None of the patients had received any DMARD treatment before baseline. DMARD doses were: AUR 6 mg/day, MTX 7.5–15 mg/week, and SSZ 2 g/day. Because this was not a randomised trial, the choice of DMARD for each patient was based only on clinical considerations; these patients represent a “real life” sample of patients with early RA seen at our centre.
Measurements
The following clinical measures were evaluated at every visit to the outpatient clinic: erythrocyte sedimentation rate (ESR), CRP, ACR 28 tender and swollen joint counts (TJC, SJC), patients and physician global assessment (0–100 scales), assessment of pain (0–100 scale), Health Assessment Questionnaire (HAQ), and the disease activity score, DAS28.
Radiographs
Radiographs of the hands and feet were taken of all patients in posterior-anterior and tangential views at baseline, and the same views were obtained during follow up. Radiographs were assessed after achieving a satisfactory intraobserver reliability (93–95%). The radiographs were scored “blinded” to treatment, in pairs (hands and feet) and in chronological sequence applying the modified Larsen method.5 The scoring procedure was performed by an experienced investigator (MCW) and documented using the “X-RayRheumaCoach” software.11 In each case, 32 joints were scored: 8 proximal interphalangeal, 2 thumb interphalangeal, 10 metacarpophalangeal, 2 wrists, 2 hallux interphalangeal, and 8 metatarsophalangeal joints (II–V). Each wrist was scored as a unit and multiplied by 5.
The aggregate Larsen score was modified by excluding grade 1 so that the scale became 0–4 (grades 1 and 0 were combined and designated grade 0, grade 2 was called grade 1, grade 3 was called grade 2, etc).12 Thus, the total Larsen score of each patient at a certain time represents the sum of all 32 joints scored as mentioned. The maximum possible score was 160.
Calculations
Time integrated values were calculated by the area under the curve (AUC) method.13 The change (Δ) in the Larsen score was calculated by subtracting baseline Larsen score values from the respective annual scores.
Statistical analysis
All data are given as means (SEM). Statistical comparisons were performed using analyses of variance followed by post hoc Bonferroni’s test. Linear correlations are Pearson product moment products. All statistical analyses were performed using SPSS 11.5 for Windows (SPSS Inc, Chicago, IL).
RESULTS
Table 1 shows the clinical baseline values of the three different groups. Forty two patients (55%) were positive for rheumatoid factor at least once during the observation period. Significant differences were seen for baseline CRP values (p<0.01), HAQ scores (p<0.01), and the SJC (p<0.01). Thus, these groups were clinically different and represented a “real life” sample of patients with early RA at our centre.
Baseline characteristics of patients with RA
Increase of joint destruction
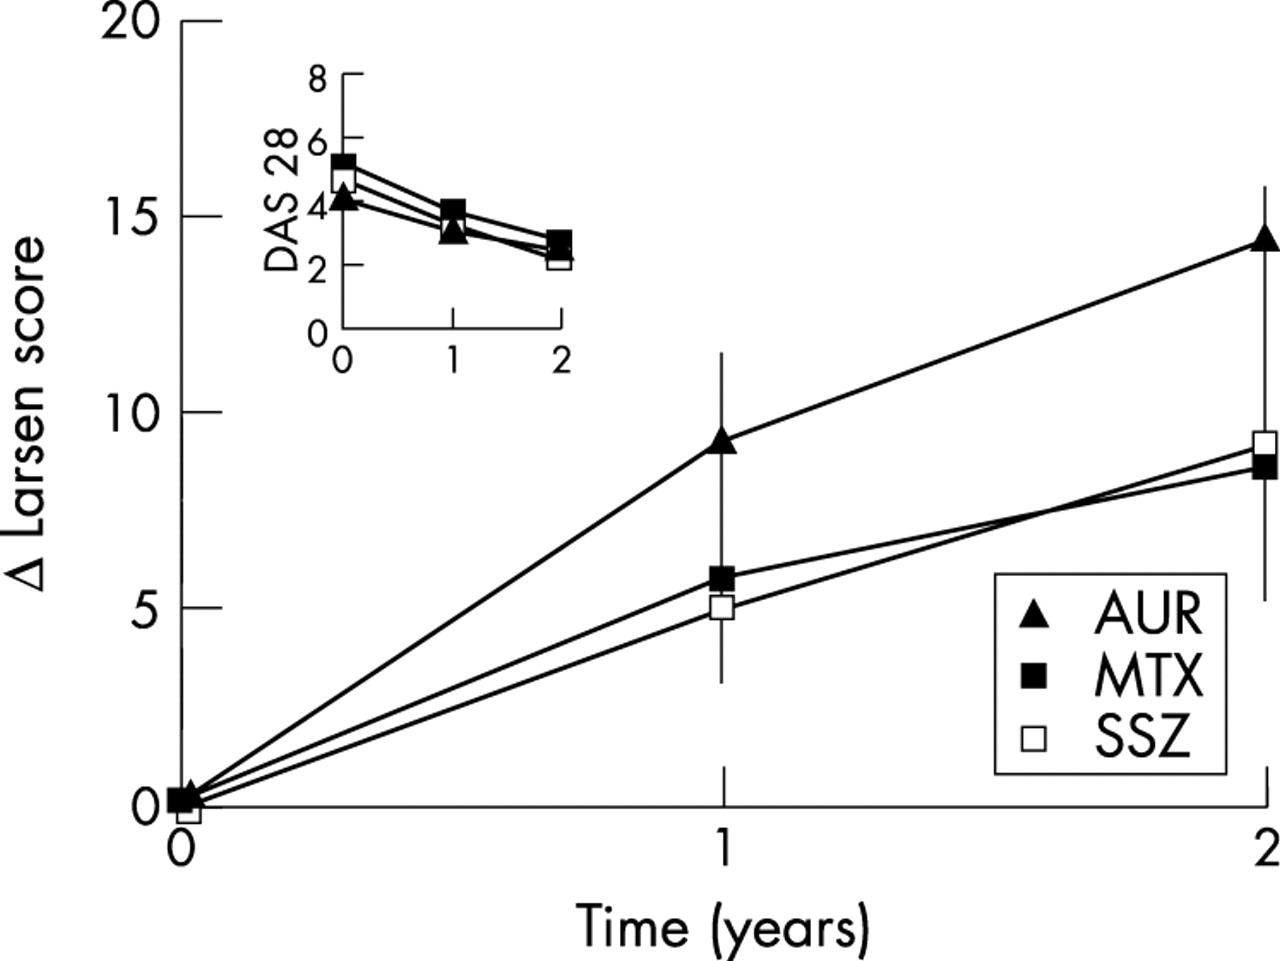
Figure 1 provides detailed information on the increment of Larsen score in the three different treatment groups. The mean (SEM) increase in radiological damage from baseline to year 2 was 10.3 (1.5), corresponding to a 3.2 (0.5)% annual increase of maximal possible damage. The progression of Larsen score during the first year (6.3 (0.3)) was more pronounced than during the second year (4.0 (0.3)).

ΔLarsen scores in three different groups of patients with early RA treated with DMARDs in the first 2 years of disease. Inset in fig 1: DAS28 scores from baseline to year 2.
Change in clinical activity and inflammation
The acute phase reactants ESR and CRP (data not shown) and the clinical outcomes ((TJC, SJC, patients and physician global assessment, assessment of pain, HAQ (data not shown)), and the DAS28 (inset fig 1)) improved significantly during AUR, MTX, and SSZ treatment after 1 year. During the 2 year observation period, the mean DAS28 value decreased from 4.6 (0.1) at baseline to 2.3 (0.1).
The mean time integrated inflammatory burden, estimated as the AUC for continuous measures of the DAS28, as mentioned above, was 1088.0 (36.8) during the first year and decreased to 865.9 (48.9) during the second year.
Analysis of the relationship between the cumulative inflammatory burden and joint destruction
Consistent with prior observations, the correlation between cumulative inflammation and radiological change in each patient during year 1 was very poor and not significant (r = 0.09, p = NS; fig 2). Similar results were obtained for year 2 (not shown). We also analysed the correlation between the changes in radiological scores during years 1 and 2 in each patient, and only a weak correlation was seen (r = 0.31, p<0.02; fig 3). Expressed in other terms, only 9% of the between-patient variability in radiological progression during year 2 is predicted by the variability during the first year.

Scatter plot on a logarithmic scale of the correlation between cumulative inflammation and radiological change in year 1.

Correlation between the changes in radiological scores during year 1 and year 2 on a logarithmic scale.
We subsequently analysed the relationship between cumulative inflammatory burden, as estimated by the AUC for the DAS28, and increase in radiological damage, according to the formula:

Thus, we established the factor ℜ for each patient in year 1 (ℜ1) and year 2 (ℜ2). A strong and highly significant correlation (r = 0.58, p<0.001) was seen between the values for ℜ1 and ℜ2 (fig 4), suggesting that the ratio between cumulative inflammatory burden and radiological progression is more stable in each patient than either component by itself. Put in other terms, approximately 35% of the second year interindividual variability in radiographic progression is predicted by combining the first year radiological progression and the cumulative inflammatory burden in years 1 and 2.

Correlation of the ℜ1 and ℜ2 values of individual patients. Linear regression analysis indicates a strong and highly significant correlation between ℜ1 and ℜ2.
DISCUSSION
A modification of the Larsen score that proved to be advantageous for long term follow up assessment of RA12 was used in this study to define further the interrelationship between clinical disease activity and joint destruction in RA.
In the ATTRACT clinical trial,3 patients who failed to achieve the ACR20 criteria for clinical improvement during treatment with MTX plus infliximab still showed diminished radiological progression, suggesting that inflammation and joint destruction are independent processes.14 Boers argued that causal links cannot be excluded on the basis of such data,15 and poor correlations between clinical and radiological responses reported in clinical trials might be due to heterogeneity of the underlying disease,16 or to alterations in clinical variables after treatment with non-steroidal antirheumatic drugs, which do not influence radiological destruction.9
In earlier work by van Leeuwen et al a significant correlation was found between time integrated CRP and radiological progression during the first 3 years of disease.9 Correlations between radiological progression and other clinical measures of disease activity were weaker. In our study, the same correlation—that is, between radiological progression and cumulative CRP during the first 2 years of disease, was considerably weaker. This may reflect a chance occurrence due, in part, to the smaller number of patients in our study, or it may reflect changes in treatments used in such a cohort. Although in the cohort studied by van Leeuwen et al 89% of patients were treated with second line agents, it is conceivable that the types and/or dose of DMARDs used in their clinical setting were different from the treatments used in our patients studied more recently. In subsequent work, van Leeuwen et al derived a very sophisticated mathematical model to describe the relationship between time integrated CRP and radiological progression in each patient.10 They showed that, when this relationship was used, an accurate prediction of radiological progression is possible. Our results confirm, to some extent, these earlier findings. However, in our model the use of time integrated CRP did not give a predictive accuracy as good as that found by van Leeuwen et al, and we found that using the time integrated DAS28 was more accurate. Some of the abovementioned differences in the cohort studied by van Leeuwen et al and by us may explain some of these differences.
It may be of significant interest to use models such as the one described by van Leeuwen et al, or here by us, in prospective studies of antirheumatic treatments. The mathematical model described by van Leeuwen is more complex, and indeed, a software program was created to allow its use in clinical practice. The model described in this paper is less complex, gaining in ease of use what it may have lost in sophistication. Additional work to reconcile various possible models would be of interest.
The hypothesis that inflammation and joint destruction are closely linked is further supported by recent data from a magnetic resonance imaging study of individual joints in patients with early RA.17 In that study Conaghan et al demonstrated that in early RA bone damage occurs proportionately to the level of synovitis, but not in its absence.
Taken together, these data suggest that joint destruction results from the cumulative burden of inflammation over time modified by an individual constant factor that accounts for the vast interindividual differences in the degree of joint destruction at any given level of inflammation. Mathematically, we have expressed this as:

where ℜ is a factor that varies from person to person and may, in some patients, even be zero (despite high inflammation, such patients do not have joint destruction). We calculated the above factor ℜ for each patient in year 1 (ℜ1) and year 2 (ℜ2) by estimating the time integrated disease activity as the AUC of continuous measures of the DAS28. The results of this analysis, despite the rather crude estimates in this model, show highly significant correlations between the values for ℜ1 and ℜ2. Thus, the predictive accuracy of subsequent radiological progression is greatly improved by taking into account not only the prior radiological progression, but also the total inflammatory burden, estimated as the AUC for continuous measures of the DAS28.
The ATTRACT3 and the COBRA18 clinical trials showed that significant improvements in radiological progression can be achieved even in ACR20 non-responders.19 Our analysis of each person’s cumulative disease activity, as measured by the AUC of the DAS28, offers a new approach that may allow the question, “Can radiological damage be reduced by certain antirheumatic treatments commensurate with a therapeutic reduction in overall disease activity?”, to be reformulated as “Can factor ℜ be reduced by certain antirheumatic treatments?”.
This model will allow us better to predict the effects of treatment on joint destruction in an individual patient, and to determine if new specific targeted treatments alter radiological progression independently of the reduction in inflammation. Some open questions, particularly those about the effect of anti- tumour necrosis factor treatments or new DMARD combinations on the interrelationship between inflammation and radiological damage, will be examined in further studies based on the methodology used in this report.
In summary, we propose a simple mathematical model to express the manner in which cumulative inflammation and joint destruction interrelate, and present data on 76 patients supporting our hypothesis that this relationship is characterised by an individual factor that remains relatively constant over a 2 year observation period.