Article Text

Abstract
Objectives: The forkhead family transcription factor Foxp3 currently represents the most specific marker molecule for CD4+CD25+ T cells with suppressive/regulatory capacity (Treg) in the mouse. Recent studies in the human system, however, indicate that the expression of Foxp3 can be T cell activation dependent. This tempted us to evaluate the significance of Foxp3 expression under autoimmune conditions with chronic T cell activation in patients with systemic lupus erythematosus (SLE) as compared with healthy controls (HCs).
Methods: Proportions of peripheral blood CD4+Foxp3+ T cells and CD4+CD25high T cells were determined in patients with active and inactive SLE as compared with HC by flow cytometry. Comparative analysis of the percentage of CD4+Foxp3+ T cells and of percentage of CD4+CD25high T cells with clinical disease activity and T cell activation marker molecule expression were performed. Finally, the induction of Foxp3 expression was analysed upon T cell activation in vitro.
Results: Proportions of CD4+Foxp3+ T cells were significantly increased in patients with SLE as compared with HC and a significant correlation was observed between clinical disease activity and proportions of CD4+Foxp3+ T cells. On the other hand, proportions of CD4+CD25high were decreased in SLE and no correlation with a T cell activation marker expression of was observed. In addition, in vitro activation of T cells induced Foxp3 expression.
Conclusions: Our data suggest that the expression of Foxp3 on CD4+ T cells in patients with SLE, at least to some extent, reflects the activation of CD4+ T cells due to underlying disease activity and does not necessarily indicate a functional regulatory T cell capacity.
Statistics from Altmetric.com
The ability of the immune system to discriminate between self and non-self is controlled by central and peripheral tolerance mechanisms. Within the last 10 years a unique CD4+CD25+ regulatory/suppressor T cell (Treg) population was found to be essential for the control of self-antigen-reactive T cells and the induction of peripheral tolerance in vivo.1 2
Initial experiments performed by Sakaguchi et al demonstrated that depletion of CD4+CD25+ T cells results in the development of autoimmune diseases in mice whereas cotransfer of these cells with CD4+CD25− T cells prevents the development of experimentally induced autoimmune diseases such as colitis, gastritis, autoimmune diabetes and thyroiditis.3–6 Likewise in humans, quantitative and qualitative alterations of Treg have been described in systemic as well as in organ-specific autoimmune disorders such as autoimmune diabetes, multiple sclerosis, autoimmune hepatitis, patients with autoimmune proliferative syndrome type II, chronic graft-versus-host-disease, rheumatoid arthritis and systemic lupus erythematosus.7–15
Both in humans and rodents, Treg are characterised by the expression of the interleukin (IL)-2 receptor α chain CD25.3 16 In contrast to rodents, however, the suppressive capacity of Tregs in humans seems to be confined to CD4+CD25+ cells with the highest expression of CD25 (CD4+CD25high), whereas CD4+ T cell with intermediate expression of CD25 might also contain recently activated T cells without Treg function.17
More recently the forkhead family transcription factor Foxp3 was found to serve as a key element for the development and function of naturally occurring Treg and is currently regarded as the most specific lineage marker of Treg.18 19 In fact, retroviral transduction of Foxp3 in CD4+CD25− T cells phenotypically and functionally converts them to natural Treg-like cells that are capable of suppression of T cell proliferation in vitro as well as the development of inflammatory autoimmune diseases in vivo.18 20 21 Most importantly and in contrast to CD25 the expression of Foxp3 was shown to be T cell activation independent.19
Initial studies revealed a comparable role of Foxp3 in the human system17 22 and the mutation of Foxp3 was found to be responsible for the development of immune dysregulation, polyendocrinopathy, enteropathy, X-linked syndrome (IPEX), which is characterised by high incidences of type 1 diabetes, thyroiditis, inflammatory bowel disease and allergic diseases.23 24 Recently, however, several groups reported that T cell receptor stimulation of CD4+CD25−Foxp3− T cells leads to the induction of Foxp3 expression. On the other hand this does not necessarily imply the acquisition of suppressive capacity. In fact conflicting data have been published concerning the suppressive capacity of CD4+CD25+ T cells with activation induced Foxp3 expression. T cell receptor stimulation was found to induce a transient Foxp3 expression on both CD4+ and CD8+ T cells; but both a parallel suppressive capacity of those cells was reported,25 26 and no suppression27 or rarely found suppression has been described.28
Therefore, mere phenotypic analysis of Treg according to the expression of Foxp3, if occurring under conditions of concurrent T cell activation in vivo or in vitro, might lead to overestimated proportions of Treg.
To evaluate the presence of Foxp3 under conditions of induced and disease-related T cell activation and in relation to the CD4+CD25high phenotype in more detail, we performed comparative phenotypic analyses of CD4+CD25high T cells and CD4+Foxp3+ T cells in healthy individuals and patients with active and inactive systemic lupus erythematosus (SLE).
MATERIALS AND METHODS
Patients and healthy controls
Patients with SLE who fulfilled at least four of the revised SLE criteria of the American College of Rheumatology29 were randomly selected from our outpatient clinic. Patients were divided into patients with inactive disease (Systemic Lupus Erythematosus Disease Activity Index (SLEDAI) <6; n = 11) and another group with active SLE (SLEDAI >6; n = 6). Sex and age-matched healthy volunteers served as a healthy control (HC) population (n = 8). Ethical approval for this study was granted by the local ethics committee and informed consent obtained.
Antibodies
The following monoclonal antibody/conjugates were used in this study: fluorescein isothiocyanate (FITC), phycoerythrin (PE), phycoerythrin–cyanin5 (PE-Cy5) and allophycocyanin labelled or unlabelled monoclonal antibodies against CD4 (SK3), CD25 (2A3), CD69 (CH4), CD71 (M-A712) and against HLA-DR (B8.12.2) were obtained from Becton Dickinson (San Jose, CA, USA); monoclonal antibodies against Foxp3 (PCH101) was obtained from eBiosciences (San Diego, CA, USA); monoclonal antibodies against CD14 (RMO52) was obtained from Beckman Coulter (Fullerton, CA, USA); FITC-labelled Annexin V was obtained from Alexis Biochemicals (Lausen, Switzerland). In all experiments, control monoclonal antibodies of the same IgG isotype were included.
Phenotypic analysis
Peripheral blood mononuclear cells (PBMC) were isolated from heparinised blood by Lymphocyte Separation Medium (PAA Laboratories GmbH, Pasching, Austria) density gradient centrifugation. PBMC were resuspended in phosphate-buffered saline (PBS)/3% human IgG (Baxter International Inc., Vienna, Austria) in order to block Fc receptors and prevent non-specific antibody binding and were incubated for 15 min at 4°C in the dark with combinations of FITC, PE, PECy5 and allophycocyanin-conjugated monoclonal antibodies. Afterwards the cells were washed with PBS/1% bovine serum albumin. Intracellular staining for Foxp3 was performed according to the manufacturer’s instructions. Individual samples were stained with a combination of five different antibodies consisting of Foxp3-FITC/CD25-PE/CD69 PE-Cy5/CD4 PE-Cy7/CD14 allophycocyanin. The samples were analysed on a FACSCanto II (BD Bioscience, San Jose, CA, USA) using FACSDiva software v.5.0.1 (BD Bioscience) and FlowJo software v 7.1.2 (Tree Star). CD4+CD14− were gated and analysed for proportions of CD4+CD25+ and CD4+Foxp3+ T cells and for the expression of CD69 on CD4+, CD4+CD25+ or CD4+ Foxp3+ T cells. Background fluorescence was assessed using appropriate isotype- and fluorochrome-matched control monoclonal antibodies.
Cell culture
Freshly isolated PBMC from HC were cultured in RPMI 1640 media (Invitrogen Corporation, UK) supplemented with 100 U/μg per ml penicillin/streptomycin, 0.5 mM sodium pyruvate, MEM, 0.05 mM non-essential amino acids, 2 mM l-glutamine, 10 mM Hepes (all from Invitrogen Corporation, Paisley, UK) and 10% heat inactivated fetal calf serum (PAA Laboratories) in 96 well U-bottom plates (Costar, Corning, NY, UK) in a humidified CO2-containing atmosphere at 37°C. For T cell activation, phytohaemoglobin (Gibco, Paisley, UK) was added.
For resting of CD4+ T cells from patients with SLE, PBMC were cultured in the presence of IL-2 (100 IU/ml) for 6 days.
At various time points, cells were harvested, washed with PBS/1% bovine serum albumin and immediately used for further phenotypic analysis. Porportions of apoptotic T cells were determined by combined staining for CD4 and Annexin V.
Assessment of clinical disease activity
The disease activity of patients with SLE was assessed using the SLEDAI.30
Statistical analysis
Values are shown throughout the paper as mean values (SD). Proportions of lymphocyte subpopulations were compared using the Student’s t test for normally distributed populations. Relationships between different values were examined using Pearson’s correlation coefficient and Spearman’s rank correlation tests. All statistical analyses were performed using GraphPad Prism (Graph Pad Prism 4.0 by Graph Pad software Inc.)
RESULTS
Phenotypic analysis of peripheral blood CD4+CD25high and CD4+Foxp3+ T cells in patients with active and inactive systemic lupus erythematosus and healthy controls
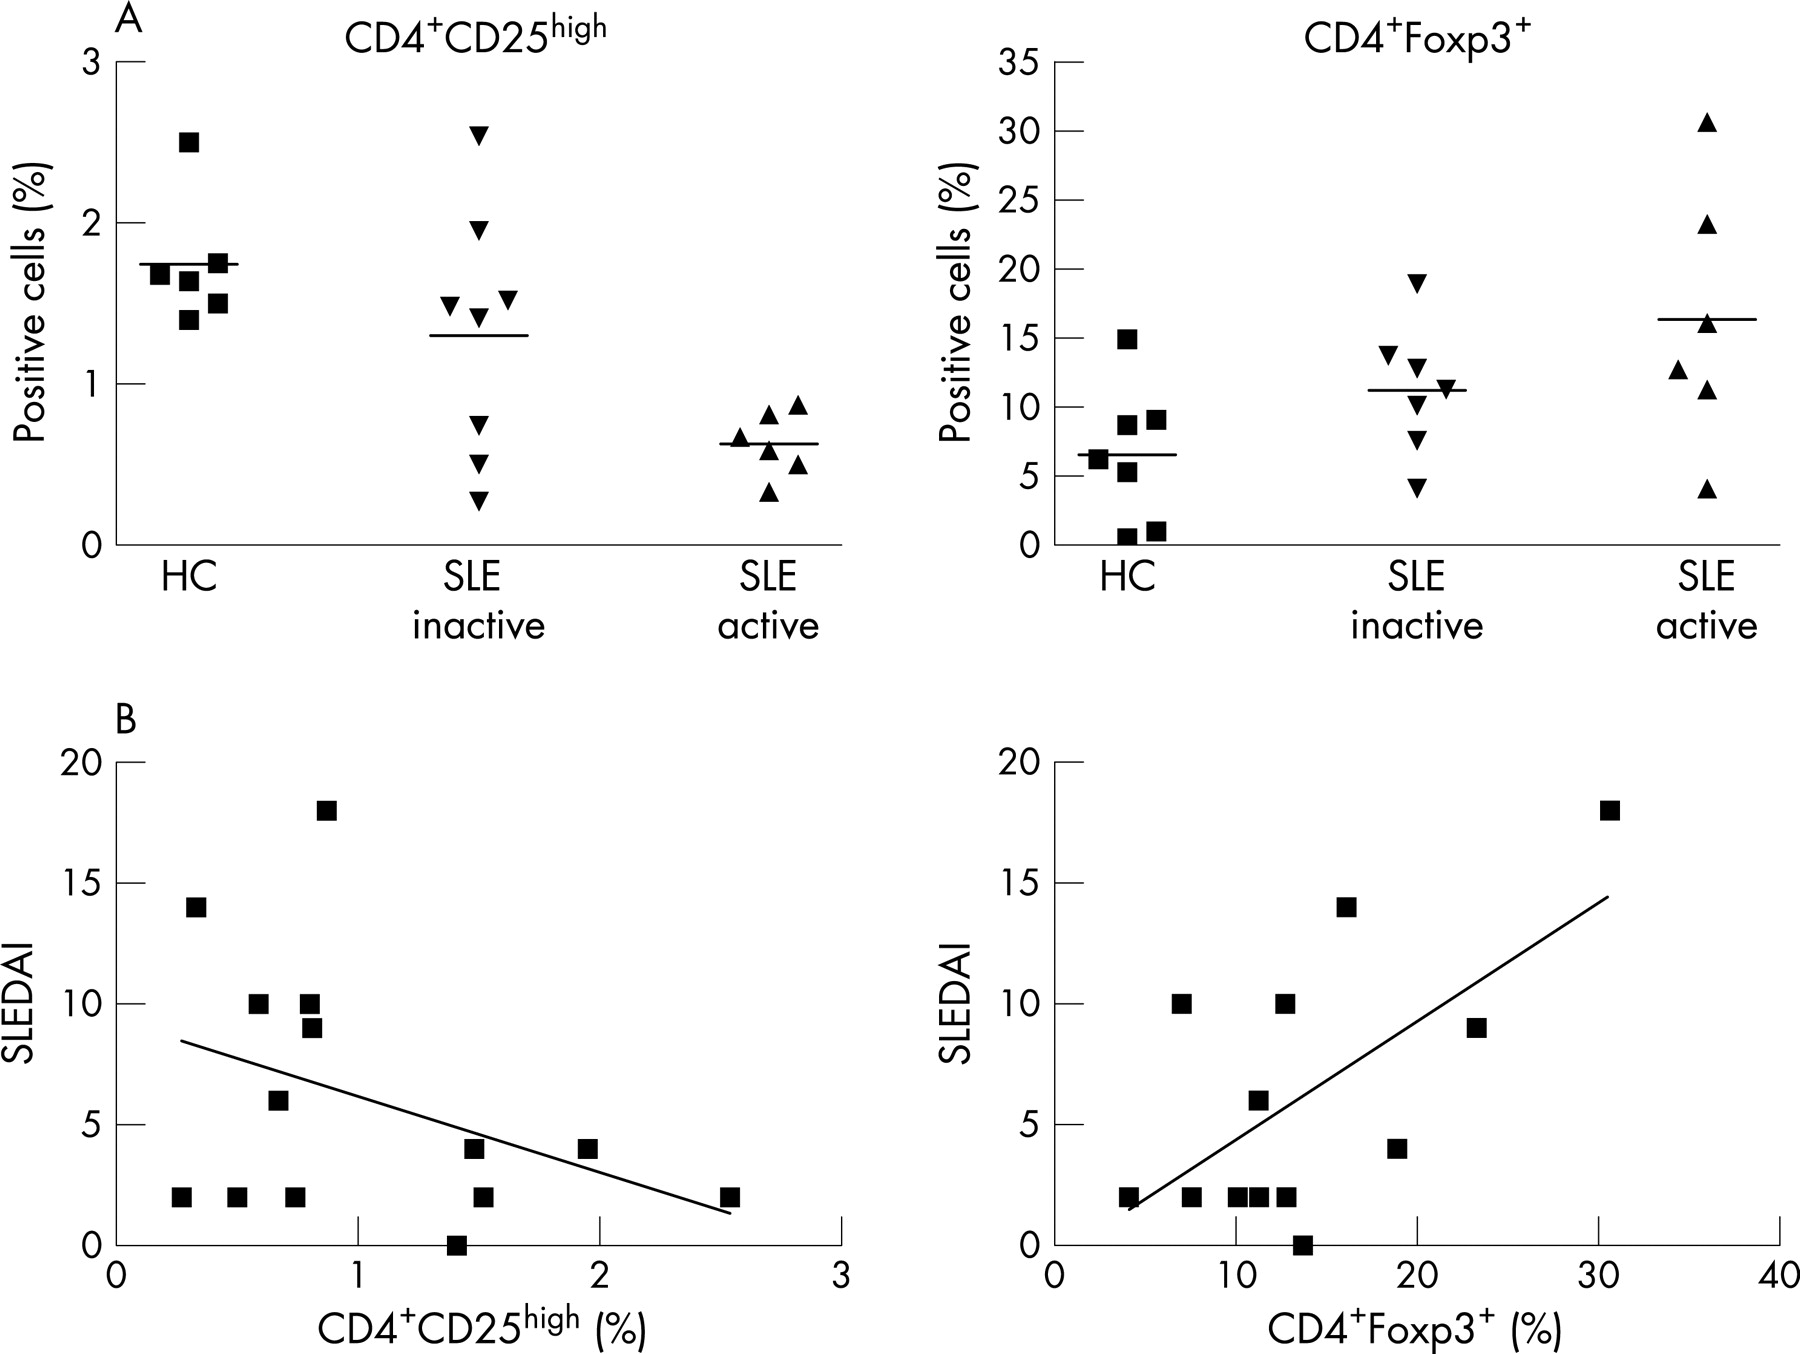
Freshly isolated PBMC from patients with active and inactive SLE and HC were analysed for proportions of CD4+CD25high T cells and CD4+Foxp3+ T cells by fluorescence-activated cell sorter (FACS) (see fig 1a,b). CD4+CD25high T cells were defined according to previous studies that demonstrated that T cells with regulatory capacity are confined to on average only 1–2% of CD4+CD25+ T cell with the highest expression of CD25.17

The proportions of CD4+CD25high Treg were significantly (p = 0.002) decreased in PBMC from inactive and even more pronounced (p<0.0001), from patients with active SLE as compared with HC (1.3 (0.27)% and 0.63 (0.08)% vs 1.8 (0.16)%, respectively; fig 2a).

In contrast, increased proportions of CD4+Foxp3+ T cells were observed in inactive (p = 0.09) and again more pronounced in patients with active (p = 0.035) SLE as compared with HC (11.2 (1.8)% and 16.35 (3.8)% vs 6.5 (1.3)%, respectively; fig 2a).
Correlation of proportions of CD4+CD25high and CD4+Foxp3+ T cells with disease activity in patients with systemic lupus erythematosus
As the above data suggested that proportions of CD4+CD25high as well as of CD4+Foxp3+ cells might be related to disease activity of SLE, we further addressed this possibility by correlating in detail the proportions of CD4+CD25high and CD4+ Foxp3+ T cells with the SLEDAI. As can be seen from fig 2(b), the percentage of CD4+CD25high was found to be inversely, albeit not significantly, correlated with the SLEDAI score (r = −0.4, p = 0.17). In contrast a strong and significant correlation was observed for proportions of CD4+Foxp3+ T cells with the SLEDAI score, (r = 0.63; p = 0.02). No significant correlation was observed for the percentage of CD4+CD25high or CD4+ Foxp3+ T cells with any kind of specific organ involvement, the daily dose of corticosteroids or the type of immunosuppressive therapy (data not shown).
Analysis of T cell activation associated marker molecules in patients with systemic lupus erythematosus and healthy controls
In patients with active and inactive SLE, T cells have been reported to display an activated phenotype by virtue of the expression of various markers of T cell activation.31 To address further the question if the overexpression of Foxp3 in patients with SLE might be related to their T cell activation phenotype, CD4+ T cells were analysed for the expression of CD69, which represents an early activation associated molecule.32 As can be seen in fig 3(a), higher proportions of CD4+CD69+ T cells were observed in inactive (1.16 (0.4)%; p = 0.1) and more pronounced in patients with active SLE (3.2 (1)%; p = 0.003) as compared with HC (0.56 (0.37)% respectively). Furthermore CD4+ T cells from patients with SLE were analysed for late activation markers like CD71 and HLA-DR, which were increased as compared with HC (data not shown) confirming the assumption that PBMC from patients with SLE contained higher proportions of activated T cells as compared with HC.

In addition the expression of Foxp3 in CD4+ CD69+ T cells from patients with SLE and HC was analysed. As shown in fig 3a, significantly higher proportions of Foxp3+ T cells were observed in CD4+CD69+ T cells from patients with SLE (86.4 (3.1)%; p = 0.02) as compared with HC (65.7 (6.8)%, respectively).
Finally, comparative analyses were performed that revealed that the proportions of CD4+Foxp3+ T cells were significantly correlated to proportions of CD4+CD69+ T cells (r = 0.8; p = 0.01). In contrast, no correlation of % CD4+CD25high T cells with % CD4+CD69+ T cells (fig 3b) was found.
Analysis of Foxp3 expression in CD4+CD25+/− T cell subsets
In contrast to CD4+CD25high Treg, CD4+ T cells with intermediate expression levels of CD25 might also contain recently activated T cells.15 We therefore analysed proportions of Foxp3+ cells in CD4+ T cells with high (CD4+CD25high) and intermediate (CD4+CD25int) expression levels of CD25 and in CD4+CD25− T cells. As can be seen from fig 4, similar proportions of Foxp3+ cells were observed in CD4+CD25high T cells from HC (88.15 (5.8)%), patients with inactive (82.8 (19.9)%) and active (90.5 (6.3)%) SLE. Higher proportions of Foxp3+ cells were observed in CD4+CD25int T cells from patients with active SLE (43.5 (32.3)%) as compared with patients with inactive SLE (29.7 (24.4)%) and HC (26.8 (6.9)%), although these differences did not reach statistical significance. In addition, significantly higher proportions of Foxp3+ cells were also observed within CD4+CD25− T cells of inactive (3.7 (1.7)%, p = 0.04) and even more pronounced of patients with active SLE (8.8 (2.5)%, p = 0.001) as compared with HC (0.43 (0.1)%).

Stimulation of peripheral blood mononuclear cells upregulates Foxp3 expression in CD4+ T cells
As our experiments so far provided indirect evidence for T cell activation dependent Foxp3 expression we next addressed the question whether the upregulation of Foxp3 is directly linked to T cell activation as reported previously.25–28 33 34 Therefore PBMC from HC were stimulated for 5 days with phytohaemoglobin in vitro. Cells were harvested at different time points during culture and analysed for the expression of CD25 and Foxp3 on CD4+ T cells. As can be seen in fig 5, increased numbers of CD4+ T cells expressed CD25 and Foxp3 already within 24 h. Interestingly, a continuous increase in proportions of Foxp3+ cells was further observed until day 5. On the other hand proportions of CD4+CD25high cells increased from day 0 to day 3 but subsequently declined until day 5.

In vitro resting of CD4+ T cells does not reveal a transient expression of Foxp3 in patients with systemic lupus erythematosus
In vitro activation induced Foxp3 expression has been shown to be transient.26 28 This raised the question whether Foxp3 is also transiently expressed in CD4+ T cells of patients with SLE due to in vivo activation. We therefore analysed Foxp3 expression in active SLE T cells before and after a resting phase of 6 days in vitro in the presence of IL-2. As can be seen in fig 6 we did not observe a decrease in % CD4+Foxp3+ T cells when PBMC from patients with active SLE were cultured in the presence of IL-2 (100 U/ml). In contrast, proportions of CD4+Foxp3+ T cells were increased on day 3 and even more on day 6 of culture. This increase was more pronounced for HC as compared with patients with active SLE. As these effects might be due to a selective depletion of T cell subpopulations cultured cells were analysed for proportions of apoptotic cells after 6 days of in vitro culture. As expected higher proportions of apoptotic Annexin V+ CD4+ T cells were observed in cultures of PBMC from patients with SLE (13 (7)%) as compared with HC (5 (1)%; n = 3). This might account for higher proportions of CD4+Foxp3+ T cells after 6 days of culture with PBMC from HC as compared with patients with SLE.

DISCUSSION
In this study we compared proportions of CD4+CD25high and CD4+Foxp3+ T cells in patients with active and inactive SLE and HCs. Our data demonstrate that increased disease activity in SLE is associated with decreased proportions of CD4+CD25high T cells but increased proportions of CD4+Foxp3+ T cells, suggesting that the expression of Foxp3 on CD4+ T cells in patients with SLE is dissociated from that of the CD4+CD25high phenotype and, at least to some extent, reflects the activation of CD4+ T cells.
As the initial identification of a unique subset of T cells with suppressive capacity by the group of Sakaguchi et al3 the phenotypic characterisation of Treg has been hampered by the lack of a Treg-specific surface marker molecule. Although Treg were described as CD4+CD25+, the IL-2 receptor α chain CD25 cannot serve as a lineage-specific surface marker molecule of Treg as CD25 is readily expressed on CD4+ and CD8+ T cells upon T cell receptor mediated activation.35 Unfortunately this holds true also for other Treg-associated marker molecules such as CTLA-4 or GITR.36 Therefore, in particular, under conditions where concurrent activation of T cell cannot be ruled out, CD4+CD25+ T cells may not solely represent Treg but most likely also contain recently activated CD4+ cells that have upregulated the expression of CD25 but have not acquired the functional capacity of Treg in parallel. This might in particular be the case in humans where, due to the exposure to a wide range of microbial infections or ongoing diseases, previously activated T cells might be contained within the CD4+CD25+ T cell population. Further studies revealed that in humans in fact only CD4+CD25+ T cells with the highest expression of CD25 (CD4+CD25high) represent the murine CD4+CD25+ Treg counterpart. Whereas the entire population of murine CD4+CD25+ T cell regardless of their level of CD25 expression was found to exhibit regulatory capacity,3 37 38 only the CD4+CD25high population was found to exhibit a similarly strong regulatory capacity in humans.17
More recently, the Foxp3 was identified as the most specific marker for Treg in the mouse. This observation is based on several lines of evidence. Foxp3-deficient mice fail to develop CD4+CD25+ Treg and succumb to scurfy-like inflammatory diseases, which can be prevented by the transfer of normal CD4+CD25+ Treg.18 Furthermore, retroviral transduction of Foxp3 in CD4+CD25− T cells converts them to functional natural Treg-like cells.18 20 21
Initial studies revealed a comparable role of Foxp3 in the human system17 22 and the mutation of Foxp3 was found to be responsible for the development of immune dysregulation, IPEX, which is characterised by high incidences of type 1 diabetes, thyroiditis, inflammatory bowel disease and allergic diseases.23 24
In line with the crucial role of Treg in the maintenance of peripheral tolerance various autoimmune diseases have been reported to be associated with reduced numbers and/or a functional defect of Treg as compared with healthy controls.7–15 Our data are in line with others describing diminished proportions of circulating CD4+CD25+ or CD4+CD25high T cells in patients with SLE and an inverse correlation with disease activity.14 Concerning the functional capacity of Treg in patients with SLE, there exist conflicting data describing both an undisturbed as well as a diminished suppressive capacity.14 15 Nevertheless, diminished numbers of regulatory CD4+CD25high T cells might play a role in the pathogenesis of SLE.
On the other hand we observed significantly increased proportions of CD4+Foxp3+ T cells and a strong correlation of proportions of CD4+Foxp3+ T cells with clinical disease activity and proportions of activated CD4+CD69+ T cells.
Foxp3 expression on CD4+ T cells was not transient in patients with active SLE as one might expect from in vitro data with activated T cells.26 28 On the one hand this might indicate a stable Foxp3 expression in CD4+ T cells of patients with SLE, alternatively transient expression kinetics might not have been detected in our experimental system due to differences in the kinetics of Foxp3 expression in response to a short-term in vitro activation as compared with chronic activation in patients with SLE in vivo.
Analysis of T cell subpopulations further revealed that Foxp3 expression was not confined to CD4+CD25high T cells alone. In particular in patients with active SLE, as compared with patients with inactive SLE or HC, higher proportions of Foxp3+ cells were observed within CD4+CD25int T cells that are supposed to contain activated T cells. In addition Foxp3+ cells were also detected within CD4+CD25− T cells of patients with active SLE. We are currently further investigating this population of CD4+CD25−Foxp3+ T cells in regard of their affiliation to regulatory or activated T cells (M. Bonelli, Ann. Of Rheumatic disease 2007, 66 (Suppl II): FRI0080, European League Against Rheumatism (EULAR), 8. annual Meeting, Barcelona, June 2007; and M. Bonelli manuscript in preparation).
In line with a previous study15 we observed an inverse correlation of percentage Foxp3 cells within CD4+CD25hi T cells with clinical disease activity scores (data not shown). This correlation, however was not statistically significant and not as strong as described by Valencia et al.15 Likewise we did not observe a significant difference for percentage Foxp3+ within CD4+CD25high T cells between patients with active and inactive SLE and healthy controls in this study.
Finally, in vitro experiments confirmed the described upregulation of Foxp3 on CD4+CD25− T cells upon activation.25–28 33 34 Interestingly, proportions of CD4+Foxp3+ cells increased continuously during 5 days of in vitro culture, whereas proportions of CD4+CD25high cells increased until day 3 but subsequently started to decline. Thus our in vitro data to a certain extent mirrored the in vivo observations in patients with SLE. Chronic T cell activation in patients with SLE on the other hand is triggered by multiple components and therefore certainly represents a far more complex process as compared with the short in vitro activation with a single strong stimuli.
Nevertheless our data strongly suggest that the highly increased proportions of CD4+Foxp3+ T cells in patients with SLE primarily result from T cell activation. This argues against the assumption that a defect in the sustenance of Treg with induced Foxp3 expression might contribute to autoimmunity in patients with SLE.26 Interestingly, however, CD4+ T cells with activation induced Foxp3 expression have been described to be hyporesponsive to further stimulation in terms of their proliferative capacity.26 In line with this, a diminished proliferative capacity is an observation that is frequently made in proliferation assays with T cells from patients with SLE.39
There are several limitations of the current study that need to be addressed. Regarding human Tregs, it is still unclear how the expression of CD25 and Foxp3 on CD4 cells relate to one another; in this regard, further investigations on developing human Tregs will be needed, an issue that cannot be easily addressed in patients with autoimmune disorders. Also, we did not study Treg function here. However, the major purpose of the study was not to confirm the functional Treg abnormalities that have previously been described in patients with SLE,15 but rather to address whether assessing phenotypic characteristics, such as Foxp3, is sufficiently reliable in light of the reduced numbers of CD4+CD25+ T cells.
In summary, phenotypic analyses of Treg based on the expression of Foxp3, or other potential activation associated marker molecules, must be taken with great caution, in particular, under conditions such as chronic autoimmune diseases where T cell stimulation might contribute and be part of ongoing disease activity, as some of these markers may be merely related to T cell activation.
REFERENCES
Footnotes
Funding: This work was supported by grant P18374-B13 of the Austrian Science Fund (FWF).
Competing interests: None.