Article Text

Abstract
Objectives The analysis of annotated transcripts from genome-wide expression studies may help to understand the pathogenesis of complex diseases, such as systemic sclerosis (SSc). We performed a whole blood (WB) transcriptome analysis on RNA collected in the context of the European PRECISESADS project, aiming at characterising the pathways that differentiate SSc from controls and that are reproducible in geographically diverse populations.
Methods Samples from 162 patients and 252 controls were collected in RNA stabilisers. Cases and controls were divided into a discovery (n=79+163; Southern Europe) and validation cohort (n=83+89; Central-Western Europe). RNA sequencing was performed by an Illumina assay. Functional annotations of Reactome pathways were performed with the Functional Analysis of Individual Microarray Expression (FAIME) algorithm. In parallel, immunophenotyping of 28 circulating cell populations was performed. We tested the presence of differentially expressed genes/pathways and the correlation between absolute cell counts and RNA transcripts/FAIME scores in regression models. Results significant in both populations were considered as replicated.
Results Overall, 15 224 genes and 1277 functional pathways were available; of these, 99 and 225 were significant in both sets. Among replicated pathways, we found a deregulation in type-I interferon, Toll-like receptor cascade, tumour suppressor p53 protein function, platelet degranulation and activation. RNA transcripts or FAIME scores were jointly correlated with cell subtypes with strong geographical differences; neutrophils were the major determinant of gene expression in SSc-WB samples.
Conclusions We discovered a set of differentially expressed genes/pathways validated in two independent sets of patients with SSc, highlighting a number of deregulated processes that have relevance for the pathogenesis of autoimmunity and SSc.
- systemic sclerosis
- autoimmune diseases
- epidemiology
This is an open access article distributed in accordance with the Creative Commons Attribution Non Commercial (CC BY-NC 4.0) license, which permits others to distribute, remix, adapt, build upon this work non-commercially, and license their derivative works on different terms, provided the original work is properly cited, appropriate credit is given, any changes made indicated, and the use is non-commercial. See: http://creativecommons.org/licenses/by-nc/4.0/.
Statistics from Altmetric.com
Key messages
What is already known about this subject?
A coupled whole blood transcriptome and immunophenotyping analysis has never been performed in patients with systemic sclerosis.
What does this study add?
Cell composition largely influences the transcriptome in a context-dependent and population-dependent manner.
A set of validated transcripts and related pathways well differentiate cases from controls.
Toll-like receptor signalling and other deregulated pathways underlie the pathogenesis of systemic sclerosis.
How might this impact on clinical practice or future developments?
Results from Reactome pathway analysis may be helpful for drug repurposing.
Introduction
Systemic sclerosis (SSc) is a complex disease characterised by immune system activation, widespread vasculopathy, fibrosis of the skin and internal organs.1 During the last decade, there has been a great advance in understanding the parthenogenesis of SSc2 with relevance in drug development and repurposing3 as well as in patient stratification and reclassification to pursue the goals of personalised medicine.4 A major contribution to the study of scleroderma pathogenesis has been given by next-generation sequencing (NGS) techniques.5–7
Gene expression profiling has long been used to understand the contribution of genes to biological functions and to discover deregulated pathways that may contribute to disease susceptibility.5 6 8 The vast majority of gene expression studies in SSc are based on microarray technology, while NGS methods, namely RNA sequencing (RNA-seq), despite their advantages over existing approaches, have had limited applications.9–13 RNA-seq yields an unlimited potential due to its resolution and deep-coverage, low sensitivity to background noise, high sensitivity at the extremes of gene expression ranges, high accuracy and concordance with quantitative PCR as well as high reproducibility.14 High-quality RNA can be extracted from whole blood (WB) samples collected with RNA stabilisers, allowing the study of large populations15 and reducing technical and source variability that may limit the reproducibility of results and introduce a systematic bias in multicentre studies.16
As a final step of transcriptome studies, differentially expressed (DE) genes are annotated to provide a biological interpretation of results.17 Usually, annotation is based on gene-set analysis failing to provide information at the personalised level. Novel strategies developed to translate gene expression data into individualised functional profiles proved more informative than gene-set enrichment analysis.18 19 The so-called Functional Analysis of Individual Microarray Expression (FAIME) algorithm18 exhibits more power compared with enrichment methods and yields reproducible results among different experiments pertaining to the same disease.20 FAIME is suitable for functional analysis in a multicohort that is characterised by a high background noise, ensuring the reproducibility of results in a discovery/validation setting.21
In the present study, we performed a genome-wide WB transcriptome analysis of patients with SSc enrolled for the multicentre PRECISESADS project. Via a thorough bioinformatic pipeline, we discovered a reproducible set of DE pathways that withstand validation in geographically diverse populations. Finally, we show how the knowledge gained from our study can be used for drug repurposing and to find candidates of druggable pathways.
Material and methods
Patients and controls
Patients with a diagnosis of SSc according to the American College of Rheumatology (ACR)/European League Against Rheumatism (EULAR) 2013 criteria22 participating in the multicentre PRECISESADS project23 were included. Patients were grouped according to their geographical origin into a discovery (Southern Europe: Italy, Portugal and Spain) and a validation (Central-Western Europe: Belgium, France, Germany, Hungary and Switzerland) set. Controls were selected for each set to match the cases according to age and gender. Patients were classified as diffuse cutaneous SSc (dcSSc) or limited cutaneous SSc (lcSSc); patients with definite SSc without fibrotic skin disease and puffy fingers were classified as lcSSc. All the patients and controls gave written informed consent for the study that was approved by local ethic committees.
RNA sequencing
Total RNA was extracted from samples collected in Tempus tubes using Tempus Spin technology (Applied Biosystems). Samples were depleted of alpha-globin and beta-globin mRNAs using globinCLEAR protocol (Ambion) and 1 µg of total RNA as input. Subsequently, 400 ng of globin-depleted total RNA was used for library synthesis with TruSeq Stranded mRNA HT kit (Illumina). Libraries were quantified using qualitative PCR with PerfeCTa NGS kit (Quanta Biosciences), and equimolar amounts of samples from the same 96-well plate were pooled. Four pools were clustered on a high output flow cell (two lanes per pool) using HiSeq SR Cluster kit V.4 and the cBot instrument (Illumina). Subsequently, 50 cycles of single-read sequencing were performed on a HiSeq2500 instrument using and HiSeq SBS kit V.4 (Illumina). The clustering and sequencing steps were repeated for three runs to generate enough reads per sample. The raw sequencing data were preprocessed using bcl2fastq software and the quality assessed using FastQC tools.24 Cutadapt25 was used to remove 3′ end nucleotides below 20 Phred quality score and extraneous adapters; additionally, reads below 25 nucleotides after trimming were discarded. Reads were then processed and aligned to the UCSC Homo sapiens reference genome (Build hg19) using STAR V.2.5.2b.26 Two-pass mapping with default alignment parameters were used. To produce the quantification data, we used RSEM V.1.2.3127 resulting in gene level expression estimates (Transcripts Per Million, TPM and read counts). A sample would pass the RNA single QC if (1) the number of reads mapped to the genes was more than 7 million and (2) the RIN (RNA integrity number) value was higher than 7.
Immunophenotyping
Immunophenotyping was performed after blood collection in Duraclone tubes (Beckman Coulter) specifically designed and optimised for the PRECISESADS study. Harmonisation of instruments used for flow cytometry analysis was described elsewhere, providing evidence of high-reproducible data in different centres.28 WB samples from patients and controls were collected in tubes with to ready-to-use unitised, dry format antibody cocktails and locally analysed within 24 hours. Flow cytometers were regularly (every 3 months) calibrated to obtain the same target mean fluorescence intensities of a reference instrument and whose coefficient of variation proved to be lower than 3.4% throughout the study.28 In addition, prior to the inclusion of any patient, a supplementary daily procedure was adopted to ensure that the deviation was below 5% for each sample.
Data analysis
For RNA seq preprocessing and DE analysis, the Limma R package29 was used. For all the other analysis, custom codes written in python by LB were used; software and libraries used for the analysis are listed in the online supplementary material.
Supplemental material
Differential expression analysis and validation
Data were first corrected for batch, age and sex effects with the voom method.30 DE analysis was performed retaining genes with a false-discovery rate (FDR)-corrected p value <0.05 and a fold-change (FC) between cases and controls FC|>1.5. DE analysis was independently performed in the discovery and validation sets and genes significant in both sets were considered as validated.
To evaluate to what extent genes selected by univariate feature selection in the discovery set jointly predicted the disease status in the validation set, a random forest model was built (500 trees) whose performance was evaluated via the area under precision-recall-gain curve (AUPRG)31 and via the area under receiver operating characteristic (AUROC).
Heatmaps were used to display validated genes: data were clustered by individuals’ similarity with the k-means algorithm and by transcript similarity, by means of the hierarchical clustering Ward method.
Functional annotation, differential expression pathway analysis and validation
Individual functional annotations were performed with the FAIME algorithm18 considering Reactome pathways32 mapped by at least 10 genes/transcripts; Entrez Ids without official gene symbols were dropped from the analysis.
To allow the comparison of FAIME scores between datasets, values were normalised to the unit interval and cube root transformation applied to unskew the data. Because FAIME scores are a composite measure of transcripts, FC cannot be used to measure the strength of pathway expression and the evaluation of effect size was used instead. Winsorised data were used to calculate the robust effect size (dr )33 and to perform t-test analysis. Annotations with a FDR p<0.05 and with a |dr |>0.62897, corresponding to a moderate effect size34 were considered as significant.
Random forest and heatmaps were used to evaluate the joint effect of functional annotations and to visualise their interactions.
Druggable functional annotations
Genes contributing to validated FAIME pathways were explored via the Drug Gene Interaction database (DGIdb).35 Functional annotations were considered as druggable if at least one gene/annotation was found in the DGIdb. Relationship between druggable annotations were explored via UpSet36 as described in the online supplementary material 1.
Association between gene expression and FAIME scores with immunophenotyping
Absolute cell counts were correlated with RNA transcripts and FAIME scores to quantify the contribution of immune cells to gene expression and function. We assumed that gene expression and functional annotations are a linear combination of expression levels of immunophenotyped cells as a function of their relative proportions.37 The elastic net regression method was applied to both sets in order to perform feature selection; L1 penalty was set to 1 (equivalent to least absolute shrinkage and selection operator) and the optimal regularisation parameters were chosen by internal fivefold cross-validation. Standardised β coefficients were used to determine the relative contribution ϕ of each of the 19 cell subtypes to the model:  . Selected features were used to build regression models in each subset and tested for their generalizability in the other set. The overall internal and external contribution of linear models to transcripts or to functional annotation was expressed by means of the adjusted coefficient of determination (adjR2). The same procedure was performed including into the model the use of steroids (prednisone >5 mg/day, yes/no), hydroxychloroquine (yes/no) and immunosuppressants (any molecule, yes/no). The final model (with or without therapy as covariate) was chosen as the one that maximised the adjR2.
Results
Overall, 162 patients with SSc and 252 controls were considered after quality check and filtering; of these, 79 cases aged 56.6±13.7 years and 163 controls aged 53.8±11.8 years were included into the discovery set and 83 cases aged 58.5±13.9 years and 89 controls aged 55.2±13.6 years were included in the validation set. Demographic and clinical characteristics of patients with SSc are reported in table 1.
Demographic and clinical characteristics of patients with systemic sclerosis (SSc) in the discovery and validation cohort
Differential expression analysis
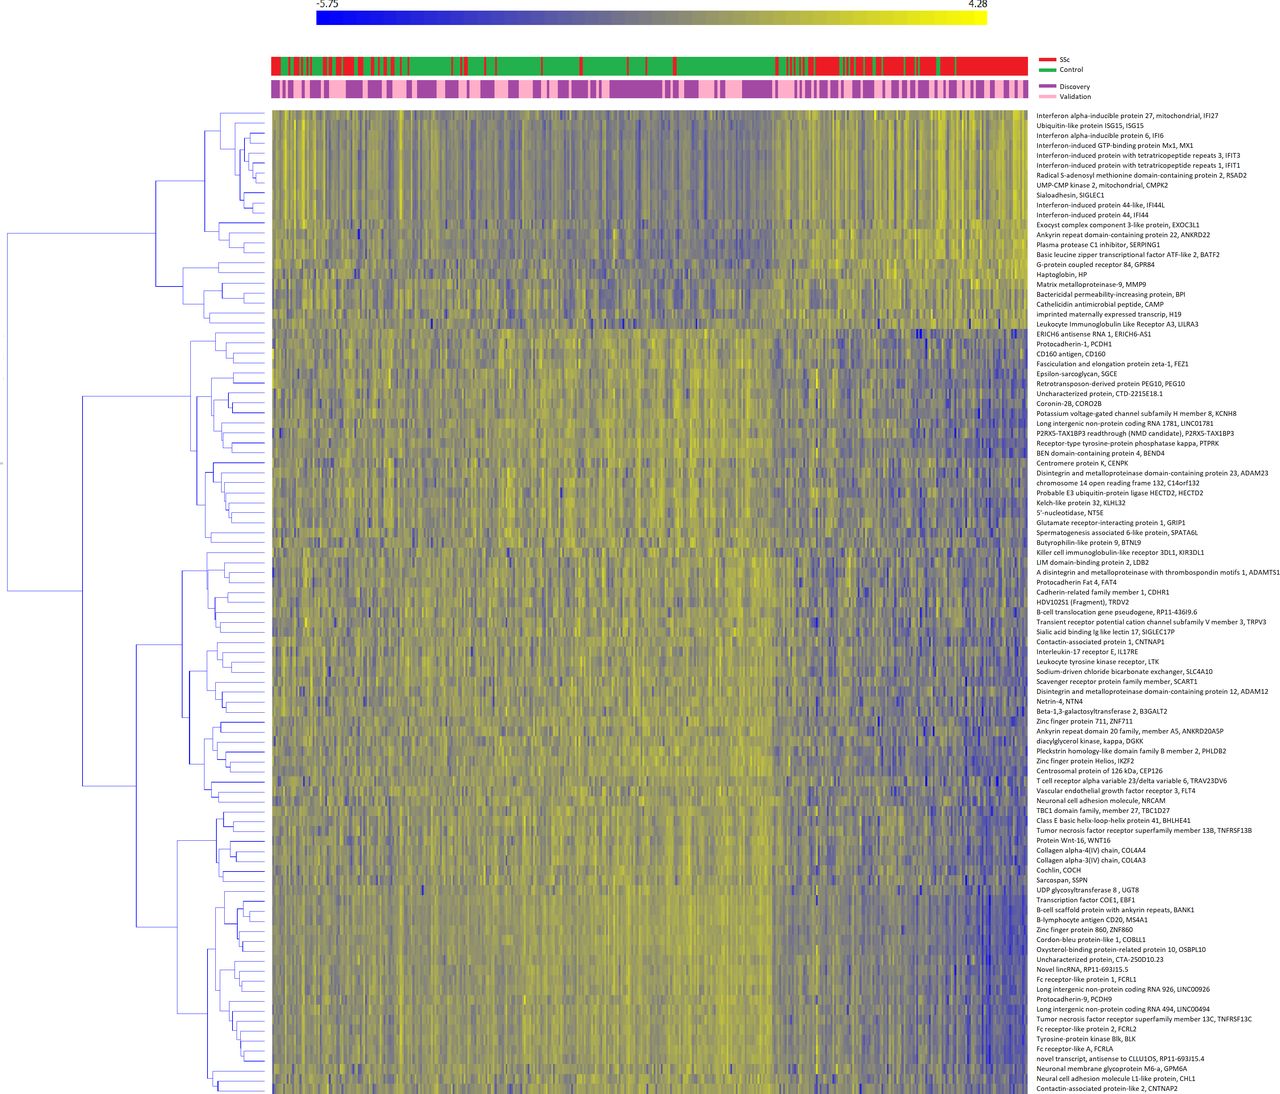
A total of 15224 genes passed the quality control and were selected for the analysis; the average number of reads/sample was 13 695 621.25 (range 8 318 927–32 665 993). Of those, 167 and 709 genes were significant in the discovery and validation sets, respectively; 99 genes overlapped between the two sets and were thus considered as replicated (online supplementary file 1). Heatmap representation of replicated genes is shown in figure 1. Cases and controls were well separated after clustering analysis (χ2=143.202, p<0.001). The majority of genes were downregulated in SSc subjects that, conversely, consistently showed an increased expression of interferon (IFN)-related genes.
Supplemental material

Heatmap of validated genes. Heatmap representation of replicated genes in the discovery (purple) or validation (pink) sets. Patients (in red) and controls (in green) are clustered column-wise via the k-means algorithm, genes are clustered row-wise via the hierarchical clustering Ward method. Patient-wise data standardisation was applied before clustering.
RNA-seq transcripts in the random forest classification algorithm could well discriminate cases from controls: with an AUROC=0.908 and AUPRG=0.851 after feature selection in the discovery set and replication in the validation set (figure 2, in comparison with Reactome pathways).

Validation of non-linear classification models fit of the random forest algorithm. Differentially expressed genes or pathways in the discovery set are used to train the model, whose performance is evaluated in the validation set. The performance is evaluated via the area under (AU) receiver operating characteristic (ROC) or precision-recall gain (PRG) curves. Black lines: curves for models trained on transcriptome data; grey lines: curves for models trained on annotated pathways.
Pathway analysis
A total of 1277 unique Reactome pathways were selected. The dr of individualised FAIME scores and the number of FDR-corrected pathways was higher in the validation set than in the discovery set (online supplementary figure 1). Overall, 241 individual pathways were different between cases and controls in the discovery set, 676 in the validation set and 225 in the intersection between the two sets (online supplementary file 2). Validated FAIME pathways are represented in the heatmap in online supplementary figures 2 and 3, clustering analysis yielded a χ2=89.385, p<0.001 for the case versus control comparison.
Supplemental material
Supplemental material
Supplemental material
Supplemental material
Selected pathways in the discovery set could well predict the class in the validation set with an AUROC=0.914 and an AUPRG=0.884 (figure 2, in comparison with WB transcripts).
Druggable functional annotations
Druggable Reactome pathways can be explored using UpSet, as shown in online supplementary figure 4. For illustrative purposes, we show an example where the existence of any drug associated with immune system activation/IFN signalling is evaluated. Two drugs, bortezomib and irinotecan, emerged as potential candidates to tackle the terms R-HSA-168256 (immune system), R-HSA-168249 (innate immune system), R-HSA-168928 (DDX58/IFIH1-mediated induction of IFN-alpha/beta), R-HSA-913531 (IFN signalling) R-HSA-909733 (IFN alpha/beta signalling) and R-HSA-109581 (apoptosis).
Supplemental material
The complete druggable pathways are included in the supplemental upset SSc\data\FAIME SSc folder (found within the online supplementary material 2) that can be explored as described in the online supplementary material 1.
Supplemental material
Correlations of gene expression and FAIME scores with immunophenotyping
Flow cytometry data were available for 203 and 144 subjects in the discovery and validation sets (table 2). Cell counts of cases and controls within each set were different for many cell subsets; additionally, cases-to-cases or controls-to-controls differences could also be observed comparing the discovery and the validation sets.
Immunophenotyping results
Results from elastic net regression analysis are detailed in the online supplementary file 3. The influence of immunophenotyping on RNA transcripts and functional annotation is summarised in table 3.
Supplemental material
Influence of immunophenotyping cell composition on differentially expressed (DE) genes and pathways
The number of regression models explaining at least 10% of the variance of transcripts/FAIME annotations after correction for concurrent therapy was higher in the validation than in the discovery set: RNA, discovery, 7998/15224 (52.5%)—validation, 9899/15224 (65%); Reactome pathway, discovery 822/1277 (64.4%)—validation, 999/1277 (78.2%). The median variance explained by meaningful regression models was also higher in the validation set than in the discovery set (22%–24% vs about 20%). Regression models limitedly predicted RNA transcripts or FAIME scores in independent populations and only 849/7730 (11%) and 89/802 (11.1%) of relevant RNA transcript or pathway models (adjR2>0.1) in the discovery population were replicated in the validation set. These results suggest that immunophenotype mostly influences RNA transcriptome and the related functional annotations in a context-dependent and population-dependent manner. Differences in cell counts between cases and controls may influence the association between meaningful regression models and DE transcripts or pathways (table 3). This association is more pronounced in the validation set as a likely consequence of a differential neutrophil count between cases and controls (online supplementary file 3). Overall neutrophils accounted for 36% and 29.3% of the variance of transcripts and for 30.7% and 27% of the variance of functional annotations in the two sets. CD4+ and CD8+ T cells were the subsets that most contributed to transcripts/annotations, while the average effect of steroids on functional pathways was no higher than 2.3% and 4.7% (online supplementary file 3).
The influence of Reactome pathways/therapies on cell subsets was exploratively analysed via elastic net models in the two pooled populations; results are reported in online supplementary file 5. Overall therapies only marginally influenced cell composition.
Supplemental material
Discussion
The present study is the first attempt to characterise the WB transcriptome in a large cohort of patients with SSc as part of an international multicentre collaborative project. The discovery/validation strategy we applied guarantees that our results are reproducible and robust against environmental factors, genetic background and phenotypic variation ensuring their generalisability.38 Indeed, the testing of findings in populations different in time, space and clinical characteristics provides an added inherent value compared with the simple replication in phenotypically similar populations, providing evidence for the causal relationship between genetic transcripts and disease.38
A larger number of DE genes were identified in the validation than in the discovery set (709 vs 167). This discrepancy seems mostly related to a different cell composition in the two populations (table 1). In particular, strong differences, both in cases and controls, were observed in the neutrophil cell count that after correlation analysis and correction for concurrent therapy emerged as the major determinant of RNA abundance (online supplementary file 3). Nonetheless, we cannot exclude that other factors may have contributed to these results, including genotype-specific characteristics or a different phenotype and severity of SSc subjects (online supplementary table 1). Attempts to elucidate the latter aspect performing subset analyses were not fully convincing due to the relatively low effect size, despite significant FDR-adjusted p values (online supplementary file 4) and hence we cannot draw any definite conclusion: both a loss of power due to a reduced sample size and a true lack of significance can be advocated as explanation.
Supplemental material
Supplemental material
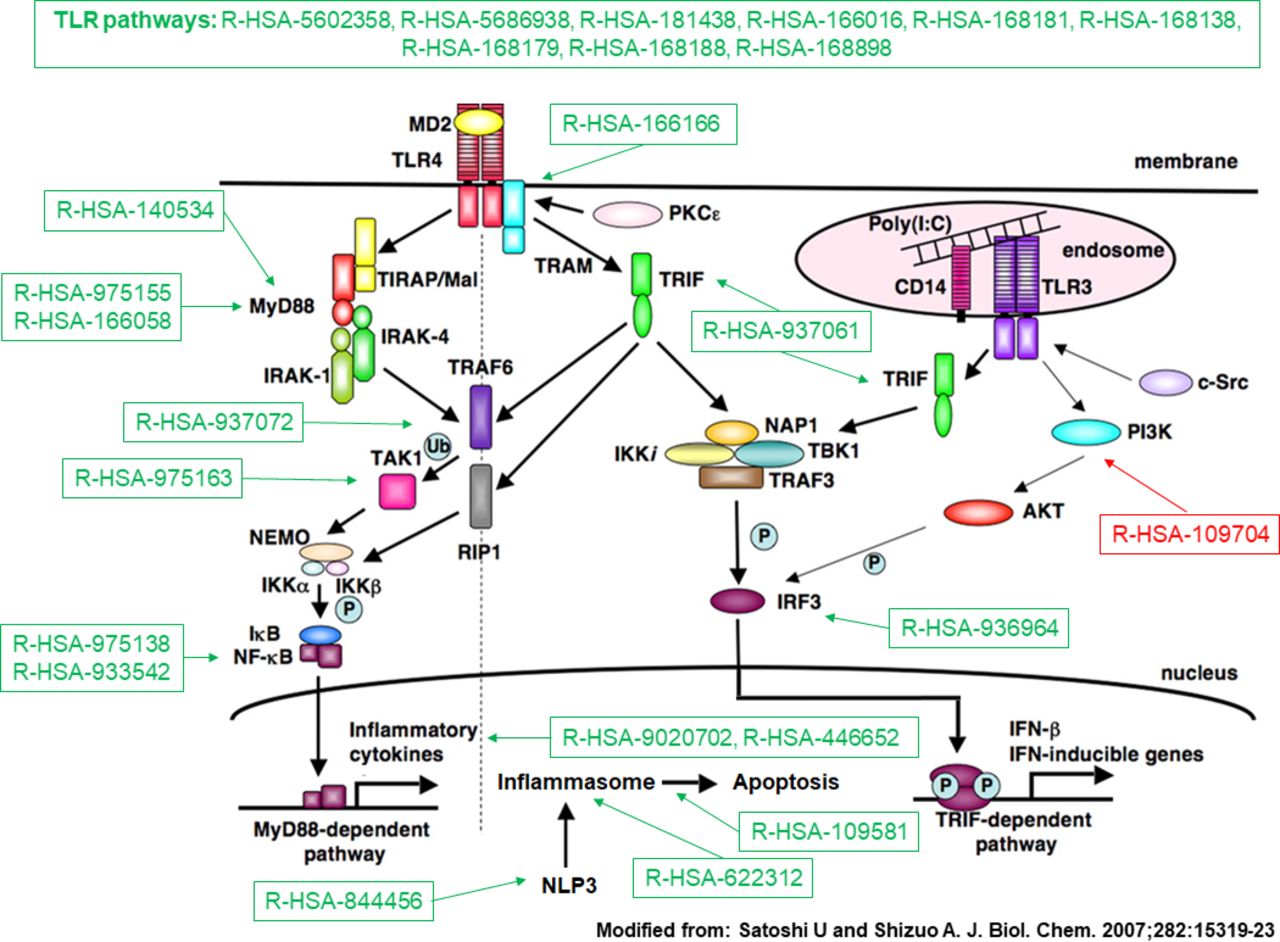
To gain biological insight on transcriptome data and to characterise deregulated pathways, we performed a functional analysis via the FAIME framework. FAIME is advantageous in the context of a multicentre study because it is capable of dissecting the heterogeneity of complex diseases, avoiding normalisation and batch effect issues.21 We could thus confirm the pivotal role of IFN activation and signalling in SSc pathogenesis39 and highlighting the deregulation of several INF-related pathways. Figure 3 summarises the processes related to the TLR cascades that eventually contribute to IFN type I40 and inflammasome induction. These findings reinforce the notion that TLR and inflammasomes could constitute a potential target in SSc.41

Toll-like receptor (TLR) pathways deregulated in systemic sclerosis (SSc). Representation of TLR pathways and downstream mediators following TLR4 activation. Deregulated Reactome pathwyas in SSc, either upregulated (in green) or downregulated (in red) according to the Functional Analysis of Individual Microarray Expression (FAIME) method. TLR pathways are consistently upregulated in SSc (top). Downstream deregulated pathways include Toll/IL-1 receptor (TIR) domain-adapter MyD88-related signalling; MyD88-independent signalling; TIR-domain-containing adapter-inducing interferon-beta (TRIF) signalling; interferon regulatory factor 3 (IRF3) activation following interaction of TRIF with noncanonical kinase TBK1; activation of the nuclear factor-κB (NF-κB) by the downstream mediators of MyD88, tumour necrosis factor receptor-associated factor 6 (TRAF6) or via the transforming growth factor (TGF)-β-activated kinase (TAK1); activation of the inflammasome by MyD88-dependent mechanisms; activation of the inflammasome NLRP3 (Cryopyrin); induction of apoptosis by inflammasomes; production of interleukin-1 (IL-1) by inflammasomes and IL-1 signalling (R-HSA-9020702, R-HSA-446652); downregulation of the negative feedback pathway constituted by phosphoinositide 3-kinases (PI3K) and its downstream target serine serin/threonine kinase Akt (PKB) (R-HSA-109704).
Other pathways of interest are those related to the tumour suppressor p53 gene (TP53). p53 is an ubiquitous protein that regulates genes involved in DNA repair, stress response, cell growth arrest and metabolism, apoptosis and senescence, ultimately inhibiting tumorigenesis.42 Point mutations of TP53 have been described in interstitial lung disease.43 The expression of p53 in fibroblasts isolated from IPF lungs is reduced compared with HC-derived fibroblasts,44 and in ex vivo experiments, the loss of p53 activity has been related to a fibrogenic phenotype and its restoration may have a role in the resolution of lung fibrosis. The deregulation of TP53 we observed in SSc (R-HSA-5633007) as a consequence of translational (R-HSA-3700989, R-HSA-6806003) and post-translational processes (R-HSA-6804758, R-HSA-6804760, R-HSA-6806003, R-HSA-6804757) may contribute to extracellular matrix remodelling (R-HSA-1474244, R-HSA-1474228) and collagen turnover (R-HSA-1442490 in both sets and R-HSA-1474290 in the discovery set). Similarly, the loss of p53 activity and reduced transcription of DNA repair genes (R-HSA-6796648) may partially explain the increased DNA damage described in SSc.45
Several other deregulated pathways were discovered by our analysis (online supplementary file 2), whose abnormalities are, in some cases, consistent with known pathogenetic mechanisms of SSc as summarised in online supplementary table.
Pathway analysis based on transcriptome data is potentially useful to discover putative therapeutic targets for drug repurposing. Herein, we describe a framework to find druggable pathways based on the curated database DGIdb35 and the UpSet visualisation tool.36 The combination of druggable pathways that can be explored is gargantuan and cannot be summarised, yet the illustrative example we provide shows the potentialities of our approach. Two drugs emerged as potential candidates to tackle immune system and IFN pathway: bortezomib and irinotecan. Bortezomib, a protease inhibitor, is currently under investigation in a phase II clinical trial.46 Irinotecan is an analogue of camptothecin (CPT),47 a topoisomerase I inhibitor capable of reducing collagen production in SSc fibroblasts.48
It could be argued that RNA-seq analysis of specific leucocyte subsets could theoretically have been more informative compared with WB analysis.49 50 Nonetheless, available methods for subset-specific expression profiling are ill-suited for large studies and the choice of the cell type to analyse is not obvious. Our correlation analysis clearly shows that population-dependent effects are unavoidable and strategies to accommodate these differences still need to be developed. Based on our experience, coupling RNA sequencing and immunophenotyping could add a valuable information to transcriptome studies and such strategy is particularly advisable in WB-based approaches.
A potential drawback of our research is related to the average long-standing disease duration of enrolled patients and the lack of a prospective evaluation. Caution should be exercised in translating our findings to early dcSSc subjects. Overall, our results are hardly comparable with findings from studies involving patients with low-disease duration, analysing other biosamples or relying on different analytical platforms (all reviewed in previous work8).
Summarising, we extensively describe modification of RNA transcripts and related annotations with functional, pathophysiological and therapeutic implications. We show that these modifications are context and population dependent although reproducible across samples with different genetic background and phenotype. Further studies are, however, required to learn to what extent our findings can be translated in non-Caucasian populations.
References
Footnotes
MEA-R and JM are joint senior authors.
Handling editor Josef S Smolen
Contributors LB: data analysis, study design, manuscript drafting, revision and approval. GB: data analysis, manuscript revision and approval. BV: data acquisition, manuscript revision and approval. CB: data analysis, manuscript revision and approval. NH: data acquisition, manuscript revision and approval. EDL: data acquisition, manuscript revision and approval. LK: data acquisition, manuscript revision and approval. RC: data acquisition, manuscript revision and approval. MG: data acquisition, manuscript revision and approval. ROC: data acquisition, manuscript revision and approval. IA: data acquisition, manuscript revision and approval. DC: data acquisition, manuscript revision and approval. CC: data acquisition, manuscript revision and approval. PRECISESADS SSc substudy group, J-OP: data analysis, manuscript revision and approval. PRECISESADS Flow Cytometry study group, ZM: data analysis, manuscript revision and approval. RL: data analysis, manuscript revision and approval. MK: data analysis, manuscript revision and approval. MEA-R: study design, data analysis, manuscript revision and approval. JM: study design, data analysis, manuscript revision and approval.
Funding This work was supported by EU/EFPIA/Innovative Medicines Initiative Joint Undertaking PRECISESADS Grant No. 115 565.
Competing interests None declared.
Patient and public involvement Patients and/or the public were not involved in the design, or conduct, or reporting or dissemination plans of this research.
Patient consent for publication Not required.
Ethics approval The study (PRECISESADS cross-sectional cohort) was approved by the following ethic committees (including those for the author listed as collaborators in the Supplemental Material): Comitato Etico Area 2 (Fondazione IRCCS Ca’ Granda Ospedale Maggiore Policlinico di Milano and University of Milan); approval no. 425bis Nov 19, 2014, and no. 671_2018 Sep 19, 2018; Klinikum der Universitaet zu Koeln, Cologne, Germany. Geschaftsstelle Ethikkommission; Pôle de pathologies rhumatismales systémiques et inflammatoires, Institut de Recherche Expérimentale et Clinique, Université catholique de Louvain, Brussels, Belgium. Comité d'Èthique Hospitalo-Facultaire; University of Szeged, Szeged, Hungary. Csongrad Megyei Kormanyhivatal; Hospital Clinic I Provicia, Institut d’Investigacions Biomèdiques August Pi i Sunyer, Barcelona, Spain. Comité Ética de Investigación Clínica del Hospital Clínic de Barcelona. Hospital Clinic del Barcelona; Servicio Andaluz de Salud, Hospital Universitario Reina Sofía Córdoba, Spain. Comité de Ética e la Investigación de Centro de Granada (CEI – Granada); Centro Hospitalar do Porto, Portugal. Comissao de ética para a Saude – CES do CHP; Centre Hospitalier Universitaire de Brest, Hospital de la Cavale Blanche, Avenue Tanguy Prigent 29609, Brest, France. Comite de Protection des Personnes Ouest VI; Hospitaux Universitaires de Genève, Switzerland. DEAS – Commission Cantonale d’ethique de la recherche Hopitaux universitaires de Geneve ; Andalusian Public Health System Biobank, Granada, Spain; Katholieke Universiteit Leuven, Belgium. Commissie Medische Ethiek UZ KU Leuven /Onderzoek; Charite, Berlin, Germany. Ethikkommission; Medizinische Hochschule Hannover, Germany. Ethikkommission.
Provenance and peer review Not commissioned; externally peer reviewed.
Data availability statement Data are available on reasonable request. Raw data are property of the PRECISESADS consortium and protected under the European General Data Protection Regulation (GDPR). Metadata and aggregated processed data are available on reasonable request to the authors and from the EGA (European Genome-phenome Archive).