Article Text

Abstract
Aims To characterise longitudinal progressive retinal changes in achromatopsia.
Methods Ultrahigh-resolution spectral optical coherence tomography (Copernicus, 3 μm axial resolution) was used to obtain tomograms of the fovea from five children and three adults with achromatopsia. Each patient was scanned twice with a mean follow-up time of 16 months. Progressive changes in reflectivity at the inner segment/outer segment (IS/OS) junction, the central macular and outer nuclear layer thickness were analysed.
Results Younger patients (<10 years; patient 1–5) showed progressive morphological changes at the IS/OS junction between visits 1 and 2. However, older patients (>40 years; patients 6–8) did not have any changes in the retinal morphology between visits 1 and 2. In patients 1 and 2, IS/OS discontinuities (visit 1) developed into a hyper-reflective zone confined to the fovea (visit 2). In patient 3, the hyper-reflective zone (visit 1) progressed to form an IS/OS disruption and early formation of a small hypo-reflective zone (visit 2). Patients 4 and 5 had a hypo-reflective zone (visit 1) which subsequently increased in size (visit 2). There was a decrease in central macular and outer nuclear layer thickness between visits 1 and 2 in children.
Conclusions For the first time, we show progressive longitudinal changes in retinal morphology in achromatopsia. Early changes include subtle IS/OS reflectivity alterations. The dynamic retinal changes in younger patients provide evidence that it represents a progressive disorder, and implementation of gene therapy during the early stages of the disease may provide best prognosis.
- Achromatopsia
- cone photoreceptors
- optical coherence tomography
- foveal hypoplasia
- genetics
- imaging
- macula
- optic nerve
- visual pathway
- visual pathway
- muscles
- retina
- vision
- iris
- anterior chamber
- angle
- cornea
- diagnostic tests/investigation
- psychophysics
- field of vision
Statistics from Altmetric.com
- Achromatopsia
- cone photoreceptors
- optical coherence tomography
- foveal hypoplasia
- genetics
- imaging
- macula
- optic nerve
- visual pathway
- visual pathway
- muscles
- retina
- vision
- iris
- anterior chamber
- angle
- cornea
- diagnostic tests/investigation
- psychophysics
- field of vision
Introduction
Achromatopsia arises from mutations of CNGB3, CNGA3, GNAT2 and PDE6C. 1–4 Recently, we have shown that patients with achromatopsia have characteristic retinal phenotypes which can be imaged using spectral-domain optical coherence tomography (SD-OCT). We identified a unique hypo-reflective zone confined to the fovea.5 This was more commonly seen in the older patients, while the younger patients mainly had a disruption of the inner segment/outer segment (IS/OS) junction. Furthermore, we noticed an asymmetric distribution of the hypo-reflective zone which had a larger area within the nasal side than the temporal side in relation to the foveola.5 This is consistent with the asymmetric distribution of cone photoreceptors.6 ,7 Thus, the hypo-reflective zone possibly represents a form of vacuolisation or degenerative products after the cone photoreceptors have undergone apoptosis.
Further in vivo imaging studies in achromatopsia have also identified the hypo-reflective zone which has also been referred to as a bubble8 and optically empty space.9 A recent case report using adaptive optics (AO) described the AO foveal images as being darker than normal, and the photoreceptors had increased spacing and reduced density when compared with controls.10 Similarly Genead et al described that patients with achromatopsia had a disrupted photoreceptor mosaic when imaged using AO.9
Previous studies have suggested that achromatopsia is associated with progressive OCT changes in the retina.5 ,8 However, these have been based on cross-sectional findings, and to our knowledge, there have been no studies with longitudinal follow up evaluating morphological and intraretinal thickness changes. In this case series, we present longitudinal OCT data describing the morphological progression of changes in patients with achromatopsia.
Patients and methods
Patients
Eight patients (Patient IDs: 1–8) with achromatopsia were identified from the Leicester Royal Infirmary, Ophthalmology Clinics. All patients underwent a detailed ophthalmological examination. Full field electroretinogram (ERG) response were performed in all patients based on International Society for Clinical Electrophysiology of Vision standards. The diagnosis of achromatopsia was based on the clinical presentation and ERG findings showing absent photopic response but normal scotopic responses. Colour vision was tested using Farnsworth D-15. There were significant errors in colour discrimination in all patients except patients 1 and 2 who are siblings. Patient 1 completed the test with only two errors, while patient 2 had no errors. Blue cone monochromatism was excluded in all males as previously described.5 Sequence analysis was performed in all patients to identify allelic variations in CNGB3, CNGA3 and GNAT2 as described previously.2 ,3 ,11 Informed consent was obtained from all volunteers participating in this study. The study adhered to the tenets of the Declaration of Helsinki, and was approved by the local Ethics Committee.
OCT scans were obtained from both eyes of the patients during the initial visit (visit 1) and during the follow-up visit (visit 2). The mean follow-up time was 16 months (range: 10–25 months). The details of the ages at visits 1 and 2, and the follow-up period for each patient are shown in table 1. None of the patients had a change in best-corrected visual acuity (VA) between the visits.
Achromatopsia patients' clinical, genetic and optical coherence tomography characteristics
Optical coherence tomography image acquisition and analysis
We used an ultrahigh-resolution spectral OCT (SOCT Copernicus, OPTOPOL Technology S.A., Zawiercie, Poland) to obtain the tomograms. In order to capture the foveal region, a 7×7 mm scanning window was used and this was centred at the fovea. The 3-D scan program (743×75; A scan × B scan) was used to obtain the region of interest. We have previously described the setup used to image patients with achromatopsia.5
The acquired images were exported from the SOCT software (version 4.1) as uncompressed bitmap files. The image files were subsequently analysed using ImageJ (available at: http://rsbweb.nih.gov/ij/) as previously described.5 We specifically assessed the tomograms for gross morphological changes between visits 1 and 2. In addition to this, we measured the central macular thickness (CMT) and the outer nuclear layer (ONL) thickness to assess if there were progressive changes between the visits.
Results
Sequence analysis
Seven out of the eight patients had homozygous or compound-heterozygous mutations in either CNGA3 or CNGB3 (table 1). Sequence analysis of CNGA3, CNGB3 and GNAT2 did not identify any mutations for patient 4. In total, we identified five different mutant alleles in CNGA3, and two in CNGB3. Of these, one mutation in CNGB3 (c.1426C>T) and one mutation in CNGA3 (c.107_110del) were novel, and are to date, unique to these patients. The nucleotide substitution c.1426C>T in CNGB3 represents a nonsense mutation and results in a premature stop codon after glutamine 476 (p.Q476X). The novel mutation in CNGA3 deletes four nucleotides (c.107_110del) creating a frame-shift after histidine 36, and subsequently also results in a premature stop codon.
Temporal retinal changes and development of the hypo-reflective zone
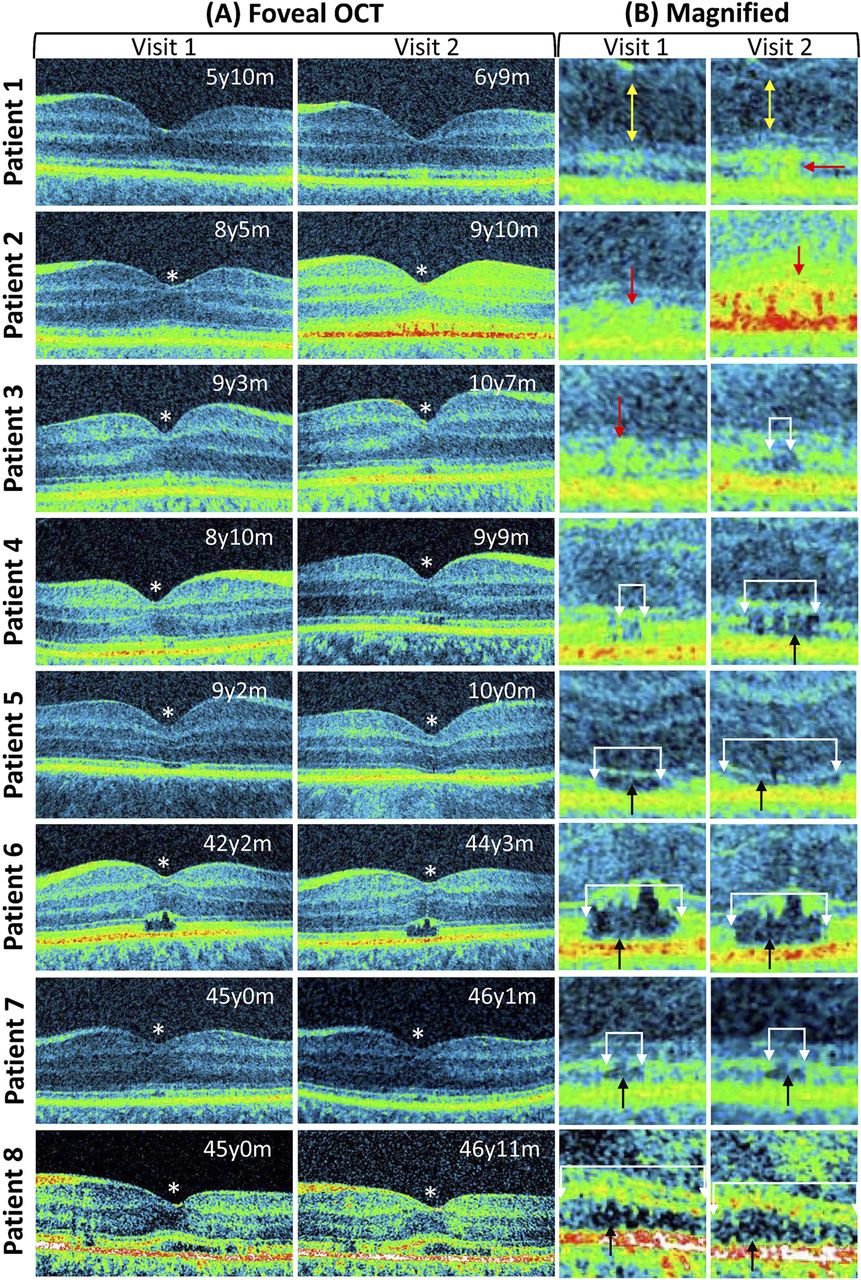
Among the eight patients we followed up, five of them (aged 5–9 years) showed altered foveal cone photoreceptor morphology on the second visit. In the remaining three patients (aged 42–45 years), there were no gross morphological changes between visits 1 and 2. These retinal changes are shown in figure 1.

Progressive retinal changes associated with achromatopsia. The foveal tomograms obtained during visits 1 and 2 are shown. In patients 1–5 the photoreceptor morphology changed between visits 1 and 2. These changes are shown in the magnified images. In patients 1 and 2, there was development of a hyper-reflective zone (shown by the red arrow). Patient 1 also showed outer nuclear thinning (yellow arrow). In patient 3, the hyper-reflective region (red arrow) developed into a disrupted inner segment/outer segment (IS/OS) junction (shown by the white arrows). In patient 4, the extent of the IS/OS disruption enlarged (white arrows) and a hypo-reflective zone developed (black arrow). In patient 5, the extent of the hypo-reflective zone and IS/OS disruption widened (white arrows). In patients 6, 7 and 8, there was no difference in the extent of the IS/OS disruption or the hypo-reflective zone (white arrows). An asterisk is used to indicate patients with shallow foveal pit and continuation of inner retinal layers indicative of foveal hypoplasia. The ages of the patients are shown at the top right side of the tomogram (y=year, m=months).
In patients 5, 6, 7 and 8, we detected a hypo-reflective zone on the tomograms obtained on visit 1. All these patients had a disrupted IS/OS junction at the region of the hypo-reflective zone. Among the older patients (patients 6–8), there were no gross morphological changes of the hypo-reflective zone between visits 1 and 2. In the child (patient 5), the size of the IS/OS disruption (visit 1=470 μm; visit 2=667 μm) was increased between the two visits, although the hypo-reflective zone appeared flatter between visits 1 and 2 (figure 1).
Interestingly, patient 4 presented during visit 1, only with a disrupted IS/OS junction and some hyper-reflectivity surrounding the site of the lesion. However, on visit 2, the size of the IS/OS disruption was increased (visit 1=157 μm; visit 2=363 μm), and this region also developed into a hypo-reflective zone. There was an asymmetric distribution for both the initial IS/OS disruption and the subsequent hypo-reflective zone. Unlike the distinct IS/OS disruption seen with patient 4, in patient 3, only a small lesion with hyper-reflectivity changes at the fovea was evident on visit 1. On visit 2, an IS/OS disruption (size=132 μm) was noted, and early hypo-reflective changes were also visible in patient 3.
During visit 1 for patient 2, we observed subtle reflectivity changes at the fovea. These reflectivity changes became more pronounced, as seen from the tomograms generated during the second visit. Similarly, patient 1 presented with slight IS/OS discontinuities during visit 1, however a hyper-reflective zone developed posterior to the foveola. In both patients 1 and 2, there were no distinct IS/OS disruption.
Changes in retinal thickness measurements
In addition to analysing the changes in the IS/OS junction disruption and reflectivity at the fovea, we also performed central macular and ONL thickness measurements. Quantitative thickness measurements at the fovea showed that both the CMT and ONL thickness had changed in the younger patients (patients 1–5) between visits 1 and 2. However, there was minimal variation in the thickness measurements for the older patients (patients 6–8) between visits 1 and 2. The difference plots showing the variation in both the ONL thickness and CMT are shown in figure 2.

The difference plots for the central macular and outer nuclear layer thickness measurements between visits 1 and 2. In the younger patients (age<10 years), there were larger changes in the measurements indicating a loss of photoreceptor cells. However, in the older patients (age>40 years), the changes in thickness measurements were minimal.
Atypical foveal hypoplasia
On visit 1, patients 2–8 had atypical foveal hypoplasia (or foveal maldevelopment—due to the continuation of the inner retinal layers posterior to the foveola). In the patients with atypical foveal hypoplasia, the inner retinal layers posterior to the foveola did not change during visit 2. In patient 1, there was no evidence of development of atypical foveal hypoplasia at visits 1 and 2.
Discussion
This study shows the progressive longitudinal retinal changes in patients with achromatopsia. By performing longitudinal studies in children with achromatopsia, we show for the first time the development of the hypo-reflective zone. In addition, we also describe an interesting OCT sign, the hyper-reflective zone, which appears to be a precursor to the development of the hypo-reflective zone. To our knowledge, this transition phase of increased reflectivity of the foveal cone outer segments has not previously been described. Other signs that indicate the progressive retinal changes in the younger patients included an increase in the size of both the IS/OS disruption and hypo-reflective zone. Furthermore, quantitative changes, such as ONL thinning and reduction in CMT, also provide evidence towards cone photoreceptor death over time. These dynamic changes were confined to the younger patients and were not seen in the older patients.
Interestingly, the hypo-reflective zone has not only been observed with achromatopsia, but has also been described in patients with solar maculopathy, occult macular dystrophy, KCNV2 mutations and Stargardt disease.12–15 A further observation made by Comander et al in patients with solar maculopathy was a hyper-reflective ring surrounding the lesion.12 The hyper-reflective ring described by Comander et al is sometimes seen in the older patients with achromatopsia (eg, see figure 1, patient 6: note the hyper-reflectivity at the top and outer edges). The significance of this is not clear, although it has been suggested that it could represent cellular debris.12 However, this is different to the hyper-reflective zone described in this study, since we observe this prior to the formation of the hypo-reflective zone. Since the hyper-reflective zone is a precursor to the development of the hypo-reflective zone, it could represent one of the early signs of cone photoreceptor degeneration.
In two patients (patients 1 and 2), we did not see the progression of this hyper-reflective zone into a discrete IS/OS disruption; this could be because it represents the early stages of their disease. Interestingly, both patients had good colour vision and could have oligocone trichromacy which is associated with a milder phenotype. Hence, the progression of the disease could be at a milder rate compared with other patients with achromatopsia. Further follow up over a longer time period may be required to observe the development of the hypo-reflective zones in the aforementioned patients.
A limitation in the study was that we were not able to perform statistical comparisons between visits 1 and 2 due to small sample numbers and the rareness of this disorder. An additional limitation is the short follow-up time (average follow up 16 months). Therefore, further large-scale studies with age and genotype stratification would be important to understand the progressive nature of this disorder and whether it is confined to certain genotypes. As children in our study were between the ages of 5 and 9 years it would be also important to include a larger range of ages of children, such as very young infants. A retrospective study by Thiadens et al reported that 12% of patients with achromatopsia had VA deterioration over time (mean follow-up time was 15 years).16 In contrast with the aforementioned study, we have not found any decrease in VA in our patients. The stable VA in our patients could be due to a relatively short follow-up period and smaller sample size. Recent cross-sectional OCT and VA studies have not been able to identify an age-dependent deterioration of VA, or correlation of VA to the development of the hypo-reflective zone.5 ,8
Previous cross-sectional studies have shown that there could be ONL thinning, which is also noted as progressive reduction in CMT. Using the longitudinal study design, we are able to confirm the progressive loss of cone cells over time which is quantified by measuring both the ONL and CMT. This is consistent with animal models of achromatopsia, which also describe ONL thinning with age.17 ,18 With the advent of the SD-OCTs, it is now possible to achieve faster scanning speeds and higher resolutions compared with the time-domain instruments. Recently, we have shown that using our instrument in patients with albinism and idiopathic infantile nystagmus, we are able to achieve highly reproducible intra-retinal thickness measurements between separate examinations.19
Interestingly, patient 4 who, phenotypically, had all features of achromatopsia, did not have any mutations in the most commonly mutated genes associated with achromatopsia, CNGB3 and CNGA3, or in GNAT2. This suggests that the phenotype in this patient could arise from mutations of PDE6C or other achromatopsia-associated genes which are yet to be identified.
Evidence from gene therapy trials in mice suggest that early treatment is most likely to result in best outcome, while intervention was less effective at older ages. This is probably due to the progressive cone photoreceptor degeneration.20 We would also suspect similar results in possible future gene therapy trials in patients with achromatopsia in light of the mouse models and the findings presented in this study.
In conclusion, this is the first longitudinal study providing evidence for temporal retinal changes associated with achromatopsia. We also describe hyper-reflectivity changes of the cone photoreceptor which is an early sign of cone photoreceptor degeneration. Assessment of the structural and retinal thickness changes over time is not only helpful to document the progression of the disease, but it could also be used as an objective measure to assess the most suitable patients and the effectiveness of gene therapy in the future.
References
Footnotes
-
Funding The study was supported by the National Eye Research Centre (Grant No: RM61G0124 and RM61G0216), Ulverscroft foundation and the Deutsche Forschungsgemeinschaft (Grant No: DFG KO 2176/1-2).
-
Competing interests None.
-
Ethics approval Ethics approval was provided by University Hospitals of Leicester.
-
Provenance and peer review Not commissioned; externally peer reviewed.
Linked Articles
- At a glance