Article Text

Abstract
AIMS/BACKGROUND Retinal vessel dilatation is a well known phenomenon in diabetes. In this study, the theory of whether excessive changes in diameter and length of retinal vessels occur in the development of diabetic macular oedema was tested, supporting a hypothesis that the development of diabetic macular oedema may be linked to hydrostatic pressure changes described in Starling’s law.
METHODS From fundus photographs of diabetic patients attending a regular eye screening programme, the diameter and segment length of retinal vessels were measured in three retinopathy groups (12 patients each) with diabetic macular oedema (DMO), background retinopathy and no retinopathy, over a period of approximately 4 years, ending at the time of diagnosis of diabetic macular oedema in the DMO group.
RESULTS A statistically significant dilatation and elongation of retinal arterioles, venules, and their macular branches was found before the diagnosis of macular oedema in the DMO group. No significant changes were found in the other two groups.
CONCLUSION It is suggested that Starling’s law applies to the formation of oedema in the retina as in other tissues.
- diabetic retinopathy
- macular oedema
- vessel dilatation
- vessel elongation
- Starling’s law.
Statistics from Altmetric.com
Starling’s law is the general principle describing fluid movement between intravascular and interstitial compartments in tissues.1 It describes the balance between hydrostatic and oncotic pressure in intravascular and tissue compartments, and how fluid flux and oedema formation depend on this balance. The law predicts that increased intravascular hydrostatic pressure in the microcirculation results in a water flux out of the circulation with oedema formation, given that the oncotic pressure is constant. Even though it is undisputed as the general principle in extracellular tissue oedema formation, this law has largely been ignored in studies on retinal oedema. Based on an earlier theory2 we have developed a hypothesis to explain the formation of diabetic macular oedema and its disappearance following laser photocoagulation. The hypothesis is based on Starling’s law and is outlined in Figure 1. In diabetes, retinal capillary non-perfusion leads to tissue hypoxia and autoregulatory dilatation of arterioles.3 Arteriolar dilatation decreases the resistance to flow, lessening the decrease in pressure in the arterioles (Poiseuille’s law) with a consequent increased hydrostatic pressure in the capillaries and venules. Increased vascular hydrostatic pressure leads to increased flow of fluid from the intravascular compartment into the interstitial tissue compartment according to Starling’s law. As the hydrostatic pressure within the capillaries and venules rises, the diameter of the vessels increases according to Laplace’s law. Kylstra and associates4 found that an increased transmural pressure in a passive tube leads to an increase in the diameter and, also, the length of the tube, or tortuosity. Robison et al reported a simultaneous development of vessel dilatation and increase in vessel length in retinal capillaries of galactose fed rats developing diabetic-like retinopathy.5

Capillary occlusion with resulting non-perfusion has been confirmed as capillary dropout.21 Resulting retinal hypoxia produces autoregulatory arteriolar vasodilatation with reduced pressure fall in arterioles and increase of capillary and venular hydrostatic pressure. Vessels dilate and increased capillary hydrostatic pressure leads to oedema formation according to Starling’s law.
Our hypothesis predicts that during the development of diabetic macular oedema we should see dilatation and elongation of the retinal arterioles and venules involved. This study was undertaken to test this hypothesis by measuring the diameter and segment length of retinal arterioles, venules, and their macular branches before the development of diabetic macular oedema and at time of diagnosis of diabetic macular oedema. Control groups involved diabetics without retinopathy and those whose background retinopathy was relatively stable throughout the observation period.
We have previously demonstrated that retinal arterioles and macular arteriolar and venular branches constrict as diabetic macular oedema disappears following laser photocoagulation, reversing the pattern described in Figure 1.6
Materials and methods
Since 1980, the diabetic eye clinic in Reykjavík has performed annual eye examinations and fundus photography on diabetic patients.7 8 The information on each examination and treatment procedure is recorded and kept on file. From our files we selected consecutive patients treated with argon laser for diabetic macular oedema between 1992 and 1994. We excluded those who had less than 12 months of follow up before they developed macular oedema, those who had received photocoagulation treatment for proliferative diabetic retinopathy, and those whose fundus photographs were of insufficient quality. A total of 45 diabetic patients received laser treatment for macular oedema during the period. Out of those, 12 patients developed macular oedema shortly after the first visit (within 12 months) or were diagnosed with macular oedema at the time of entrance into the screening programme. The fundus photographs of eight patients were of insufficient quality to allow measurement of vessels and 15 patients had received laser treatment previously. This left 12 patients with macular oedema to participate in the study, each with two fundus photographs taken with at least a 12 month interval.
As retinal vessel dilatation in diabetic subjects is a well known phenomenon,9-11 a comparison of vessel measurements between the macular oedema group (DMO group) and control groups was mandatory. Two control patients, one with background retinopathy (BDR group) and the other with no retinopathy (NDR group), were matched to each patient in the DMO group with characteristics that were as similar as possible to the patients with macular oedema. The control patients were selected from the files of 544 patients with type 1 and type 2 diabetes participating in our regular screening programme in 1990. Background retinopathy was defined as microaneurysms, haemorrhages, hard exudates, with no signs of macular thickening, neovascularisation, soft exudates, intraretinal microvascular abnormalities, or venous beading.12 Two variables were kept identical between the three groups—type of diabetes and sex. Therefore, in each 12 patient group, three had insulin dependent diabetes and nine had non-insulin dependent diabetes and each group comprised six men and six women. In addition, duration of disease, age, and interval between measurement photographs were kept as similar as possible to the DMO group. The entire control selection process was carried out before any measurements were done on the vessels. Those with rapidly progressing background retinopathy were not included to minimise the possibility of choosing a patient with imminent macular oedema.
For the DMO group, colour fundus photographs of sufficient quality to be measured had to be available, taken at the time of diagnosis of diabetic macular oedema and at an earlier time, at least 12 months before the time of diagnosis. The measurements were done on the oldest available photograph and a photograph taken at the time of diagnosis of DMO. The average time interval between these two measurements was 44.2 (SD 20.8) months. The average age of patients and duration of diabetes were 61.5 (13.4) years and 13.8 (5.2) years, respectively.
The patients in the BDR group had background diabetic retinopathy at the beginning and end of the follow up period. They only had microaneurysms, haemorrhages, and hard exudates not associated with thickening of the retina, consistent with mild non-proliferative retinopathy. The patients without retinopathy had no signs of diabetic eye disease on either photograph or on annual photographs in between. The average time interval between the initial and final photographs was 49.8 (11.4) months in the BDR group and 47.3 (11.0) months in the NDR group. The mean age of patients and duration of diabetes at the time of the second photograph, were 56.6 (12.4) years and 15.3 (5.5) years for the BDR group and 60.7 (16.0) years and 15.0 (5.5) years for the NDR group, respectively.
We compared the means of the average time interval, age of patients, and duration of diabetes between the three groups, using a one way analysis of variance (ANOVA). The difference was not statistically significant.
In all cases the diameter of temporal retinal arterioles and venules and their macular branches was measured on the initial and final photographs, as well as the segment length of the superior temporal vessels. Statistical analysis was performed with the two tailed, paired Student’s t test.
DIAMETER MEASUREMENTS
The width of the retinal vessels was measured from colour fundus photographs with projection micrometry, which has been found to be a reproducible and reliable technique.13 14 The superotemporal and inferotemporal arterioles and venules were measured 1 disc diameter from the optic disc and the macular branches of the superotemporal and inferotemporal arterioles and venules were measured 1.5–2 disc diameters temporal to the optic disc. The superior temporal branches were measured 0.5–1.5 disc diameters above the superior end of the optic disc and the inferior temporal branches 0.5–1.5 disc diameters below the inferior edge of the optic disc. The photographs were projected onto a flat white screen and the vessel diameters were measured using a digital caliper and expressed in millimetres. The horizontal diameter of the optic disc was measured and divided into the vascular diameter measurement to correct for difference in magnification between the initial and final photographs. For each vessel measured, the diameter as calculated in disc diameters was set at 1 for the final photograph and the diameter on the initial photograph expressed as the ratio of the measurement on the final photograph.
The reproducibility of this method was measured with one investigator measuring the diameter of four different vessels (two arterioles and two venules), five times each. The average coefficient of variation of repeated measurements was 2.2%.
VESSEL SEGMENT LENGTH MEASUREMENT
The same colour slides were used for the vessel length measurements as for the diameter measurements. Each slide was digitised into a Macintosh fx computer via a video camera (Panasonic F15) mounted onto a Carl Zeiss Jena microscope (Technival 2). The image was then transferred to Canvas 3.02 software, where the superior arterioles and venules were traced with a mouse and length measured from first vessel bifurcation to the most distal macular bifurcation. As for the measurements of the vessel diameter, the horizontal diameter of the optic disc was divided into the vessel length to correct for difference in magnification between the initial and final photographs. For each vessel measured, the vessel length as calculated in disc diameters was set at 1 for the final photograph and the vessel length on the initial photograph expressed as the ratio of the measurement on the final photograph.
The reproducibility of this method was measured with one investigator measuring the length of four different vessel segments (two arterioles and two venules) five times each. The average coefficient of variation of repeated measurements was 0.35%.
Results
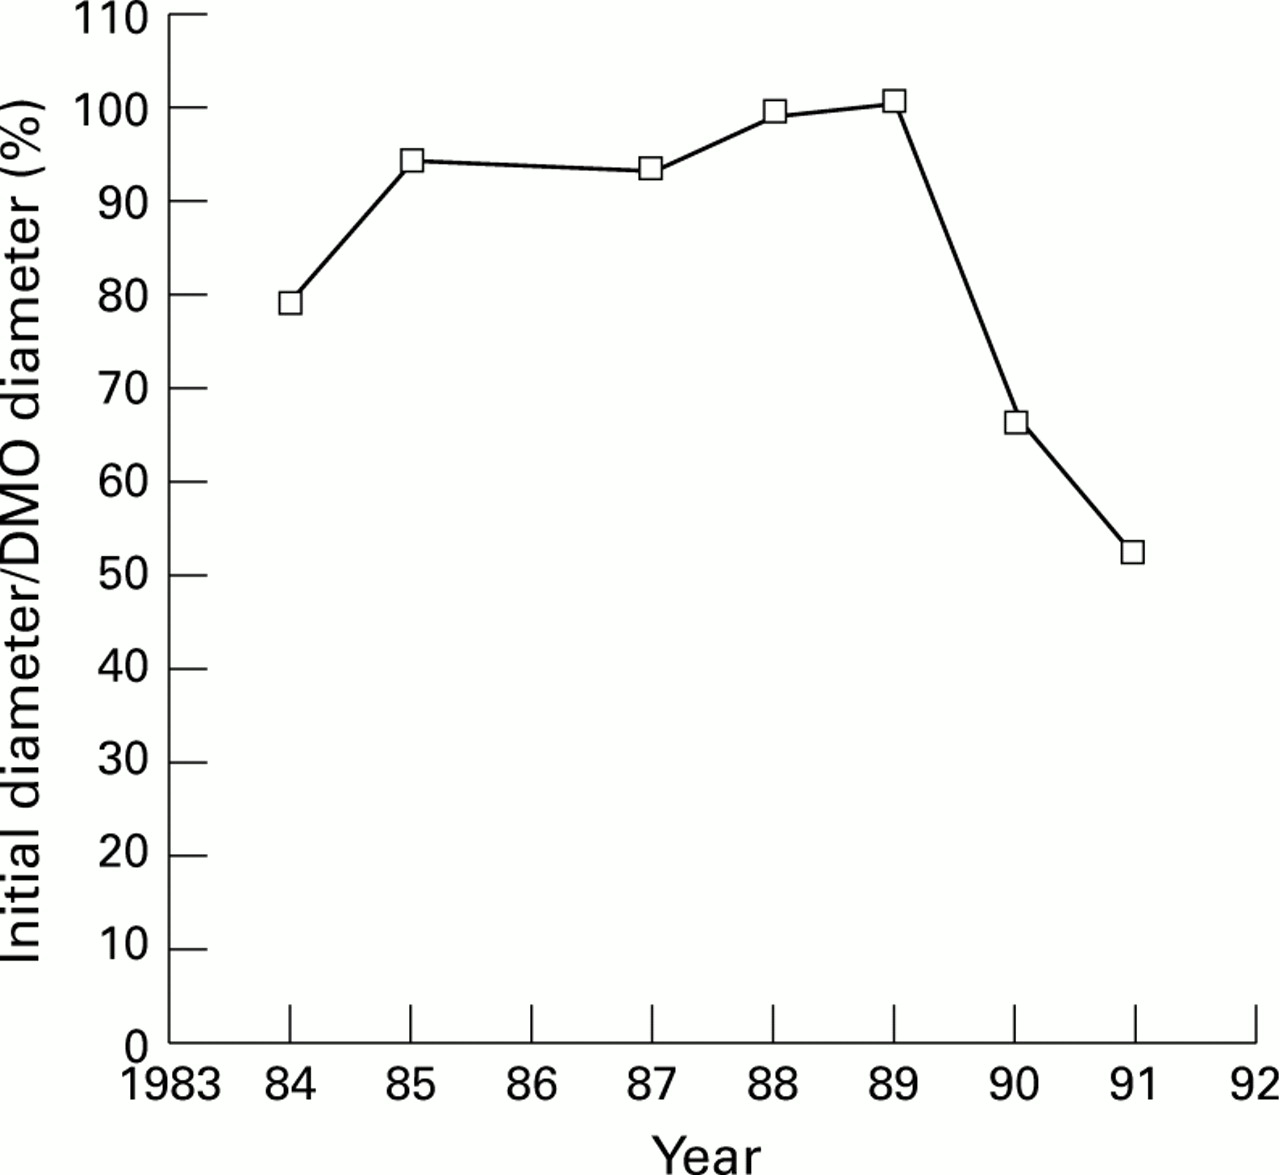
In the DMO group the diameter of the retinal temporal arterioles and venules and the macular branches was significantly greater at the time of diagnosis of diabetic macular oedema when compared with the earlier photograph taken, on average, 44 months earlier (Table 1). No significant change was seen in the diameter of retinal vessels in the BDR and NDR groups. The change in diameter of the retinal vessels in the DMO group was significantly different from the NDR and BDR groups (Table 2). Comparing the BDR and NDR groups gave no statistically significant difference in the diameter changes of the retinal vessels except for the superior arteriole, where the superior arterioles in those with no retinopathy dilated significantly more than in those with background retinopathy (p = 0.0323). Figure 2 shows the diameter change of a superotemporal arteriolar branch in one patient over several years before diagnosis of DMO and 2 years after laser treatment.
Change in diameter in the groups: initial diameter/final diameter. Mean, standard deviation (SD), and the p value (where this is below 0.05) is given using a paired two tailed Student’s t test (n=12)
Change in diameter in the groups compared using a paired two tailed Student’s t test. (Initial length/final length group A) − (initial length/final length group B). Average difference between the groups and p value is given

Diameter changes of superior macular arteriolar branch of one patient over a period of 7 years, with the diameter set at 1 at the time of diagnosis of diabetic macular oedema, in 1989. Macular grid laser treatment was given in 1989 with a resulting constriction of the arteriolar branch.
In the DMO group, the measured segments of the superotemporal arterioles and venules and their macular branches were significantly longer at the time of diagnosis of diabetic macular oedema when compared with the initial photographs (Table 3). No significant elongation of vessel segments was seen in the BDR and NDR groups. The changes in length of the retinal vessels in the DMO group were significantly different from the NDR (arteriolar branch p = 0.0022, venular branch p = 0.0108) and BDR (arteriolar branch p <0.0001, venular branch p = 0.0019) groups. Comparing the BDR and NDR groups showed no statistically significant difference in the length changes of the retinal vessels.
Vessel segment length changes in the diabetic macular oedema (DMO) group and the control groups: 100 × initial length/final length. Mean, standard deviation (SD), and p value of Student’s t test are given (n=12)
Discussion
The data fail to disprove the hypothesis outlined in Figure 1. A statistically significant dilatation and elongation of superotemporal and inferotemporal arterioles and venules and their branches precede the formation of DMO.
In a previous report we documented a significant constriction of the same vessels following macular grid photocoagulation for DMO.6 These vessels serve the macular region, where the oedema formation takes place and laser photocoagulation is applied. Our findings strongly suggest that the pattern depicted in Figure 2 is typical for vessel changes before and after treatment for DMO. Laser photocoagulation of the macula creates an oxygen flux from the choroid to the inner retina15 16 and the improved oxygenation will lead to an autoregulatory constriction of the arterioles which will reverse the mechanism outlined in Figure 1.6
DIAMETER
Oxygen is a major factor in regulating retinal vessel diameter. Arterioles dilate when oxygen tension falls, for example when retinal capillaries become non-perfused. Grunwald et al found that in diabetic retinopathy, retinal vasculature shows a considerable regulatory response to oxygen, although somewhat less than in normal individuals.17 According to Poiseuille’s law, vasodilatation of arterioles causes a lessening of pressure decrease in the arterioles, which results in increased capillary and venous hydrostatic pressure: ΔP = Q8ηl/πr4 (1) where ΔP is the pressure decrease in vessel, Q is the blood flow, η is the blood viscosity, l the vessel length, and r the vessel radius.
Starling’s law states that if the vascular transmural difference in hydrostatic pressure is greater than the oncotic pressure difference between the interstitial matter and blood, oedema will form: ΔP − ΔQ = 0 (2) where ΔP is the vascular transmural difference in hydrostatic pressure, and ΔQ the oncotic pressure difference between the interstitial matter and blood. If hydrostatic pressure in the vascular compartment rises relative to the tissue pressure, this will increase the rate of fluid movement from the vessel into the tissue and form oedema if the oncotic pressure gradient remains constant. Conversely, decreased hydrostatic pressure in the vessels will pull fluid back into the vascular compartment and decrease oedema if the oncotic pressure stays unchanged.
The increased hydrostatic pressure will also dilate capillaries and venules according to Laplace’s law: T=ΔPr/e (3) where T is the wall tension of the vessel, ΔP constitutes the transmural pressure difference, r is the vessel radius, and e relates to the wall thickness and elasticity. Kohner and Porta reported that generalised dilatation of capillaries was almost invariably present in patients with maculopathy.18 Studying the retinal vascular response to 100% oxygen breathing, Grunwald and associates found that there was a relation between decrease in retinal blood flow and decrease in venular diameter in diabetic subjects, but not in normal individuals.17 They concluded that this correlation could indicate that the major veins in diabetic eyes adapted more passively to the changes in blood flow than the veins in normal eyes.
VESSEL LENGTH
According to the studies of Kylstra and associates, dilatation of a tube secondary to increased transmural pressure is associated with an increased length and tortuosity of the tube.4 If this principle is applied to human vessels, an increased length and tortuosity should go hand in hand with dilatation of the vessels. In a recent report, Robison et al reported increases in vessel length as well as dilatation of retinal capillaries after inducing diabetic retinopathy in a rat model with galactose feeding.5 After administration of sorbinil, an aldose reductase inhibitor, the capillary length and diameter decreased simultaneously to baseline values.
With the use of computerised image processing the length of vessels can be measured directly, eliminating the use of tortuosity formulas. Measurement of vessel segment length is more accurate than that of vessel diameter, depending less on the quality of the fundus photograph than does the measurement of vessel diameter.
An increase of retinal arteriolar9 19 and venular diameter9 10 19 in diabetic subjects compared with normal subjects has been reported. These studies suggest a gradual dilatation of the vessels over decades. In our study we measure vessel diameter over a few years and separate groups with different stages of retinopathy. We found no statistically significant change in vessel diameter in the control groups, and no change in retinal vessel diameter or segment length over an average period of 50 (BDR group) and 47 months (NDR group). Progressive average vasodilatation in diabetes9 may reflect dilatation in those with highly progressive retinopathy while those with less progressive disease have more constant vessel diameters. Grunwald et al reported a significantly larger average diameter of retinal venules in eyes with proliferative retinopathy and macular oedema compared with eyes with proliferative retinopathy but no oedema.20
Our measurements demonstrate dilatation and elongation of arterioles and venules serving the macula preceding the formation of diabetic macular oedema. No significant vessel dilatation or elongation occurred in matched diabetic controls over a similar period of time. This suggests that Starling’s law, the general law of oedema formation in the body, may participate in the pathophysiology of retinal oedema.
Acknowledgments
Supported by Research Funds of the University of Iceland and Landakotsspítali, The Icelandic Diabetes Association and the Helga Jónsdóttir and Sigurlidi Kristjánsson Memorial Fund.
Presented in part at the annual meeting of the Association for Research in Vision and Ophthalmology in Sarasota, Florida, in May 1993 and May 1995.