Article Text

Abstract
Background Bladder cancer (BLCA) is a challenging malignancy with a poor prognosis, particularly in muscle-invasive cases. Despite recent advancements in immunotherapy, response rates remain suboptimal. This study investigates the role of METTL3, an m6A RNA methylation “writer,” in regulating the immune microenvironment of BLCA.
Methods Through bioinformatics analysis, we identified METTL3 as being associated with the formation of an immunosuppressive microenvironment in BLCA and poor response to immunotherapy. Subsequently, we silenced METTL3 expression in BLCA cells using short hairpin RNA (shRNA) or inhibited its function with STM2457. The effectiveness of these interventions in remodeling the BLCA tumor microenvironment (TME) was confirmed through animal experiments and flow cytometry. Mechanistically, RNA sequencing and methylated RNA immunoprecipitation (MeRIP) sequencing revealed the molecular pathways by which METTL3 regulates the TME. This was further validated using in vitro cell co-culture, immunoprecipitation, ELISA, and RNA degradation assays. The synergistic effect of METTL3 with anti-Programmed Cell Death Protein 1 (PD-1) treatment in BLCA was confirmed in both orthotopic and ectopic BLCA animal models.
Results METTL3 was found to increase CXCL5 levels and suppress CCL5 expression in an m6A-dependent manner, leading to increased recruitment of myeloid-derived suppressor cells (MDSCs) and reduced infiltration of CD8+T cells. Silencing METTL3 or inhibiting its function restored immune cell balance and significantly enhanced the efficacy of anti-PD-1 therapy. Clinically, METTL3 overexpression correlated with poor complete response rate to immune checkpoint inhibitors (ICIs) therapy, associated with an immunosuppressive microenvironment characterized by elevated MDSC levels and reduced CD8+T cell infiltration.
Conclusions These findings highlight METTL3 as a key regulator of the immune microenvironment in BLCA and a promising therapeutic target to improve immunotherapy outcomes. Targeting METTL3 could potentially enhance the efficacy of ICIs in patients with BLCA.
- Bladder Cancer
- Cytokine
- Immunotherapy
- Myeloid-derived suppressor cell - MDSC
- T cell
Data availability statement
Data are available upon reasonable request. Publicly accessible data, including the TCGA BLCA cohort, can be obtained from Xena (https://xenabrowser.net/datapages/). The IMvigor210 data relevant to BLCA immunotherapy were sourced from the R package IMvigor210CoreBiologies. Single-cell sequencing data were derived from previous publications (GSE135337).
This is an open access article distributed in accordance with the Creative Commons Attribution Non Commercial (CC BY-NC 4.0) license, which permits others to distribute, remix, adapt, build upon this work non-commercially, and license their derivative works on different terms, provided the original work is properly cited, appropriate credit is given, any changes made indicated, and the use is non-commercial. See http://creativecommons.org/licenses/by-nc/4.0/.
Statistics from Altmetric.com
WHAT IS ALREADY KNOWN ON THIS TOPIC
Inhibition of METTL3 expression suppresses the proliferation, metastasis, and angiogenesis of bladder cancer (BLCA); however, its impact on immune cell infiltration in BLCA tissues and the underlying mechanisms remain unclear.
WHAT THIS STUDY ADDS
This study demonstrates that silencing or inhibiting METTL3 reduces CXCL5 secretion while increasing CCL5 secretion, leading to decreased infiltration of myeloid-derived suppressor cells (MDSCs) and enhanced infiltration and activation of CD8+T cells.
These changes reprogram the immune microenvironment of BLCA, ultimately improving the efficacy of anti-PD-1 therapy.
HOW THIS STUDY MIGHT AFFECT RESEARCH, PRACTICE OR POLICY
These findings underscore the pivotal role of METTL3 in alleviating immune suppression in BLCA and highlight the potential clinical value of targeting METTL3 to inhibit BLCA progression and enhance immunotherapy outcomes.
Introduction
Bladder cancer (BLCA) is the fourth most common cancer in men, with about 16840 patients succumbing to the disease.1 In China, 92,900 new cases of BLCA and more than 40,000 deaths are estimated in 2022, highlighting the continued severity of the situation.2 Despite various emerging treatment options, the prognosis for BLCA, particularly muscle-invasive BLCA (MIBC), has not significantly improved.3 The 5-year recurrence and progression rates of non-muscle invasive BLCA (NMIBC) can reach up to 78% and 45%, respectively. Furthermore, around 30% of patients with MIBC experience recurrence within 1-year post-radical surgery, and the survival rate for patients with distant metastasis is particularly disheartening. BLCA, considered the most expensive malignancy to treat, imposes a significant economic burden on patients and severely impacts their quality of life.4 5
Immunotherapy, especially immune checkpoint inhibitors (ICIs), has emerged as a promising treatment for MIBC and metastatic BLCA.6 7 While clinical trials such as the Phase III CheckMate 274 have shown that nivolumab significantly improves progression-free survival in high-risk patients post-radical surgery,8 not all trials have been successful; for instance, the IMvigor 010 trial did not demonstrate benefits with atezolizumab.9 Despite these advances, the low response rate to immunotherapy in BLCA remains a significant challenge, prompting ongoing research to enhance efficacy and overcome resistance. The tumor microenvironment (TME) is pivotal in determining immunotherapy outcomes, with immune cells within the TME serving as both targets and modulators of treatment.10 Chemokines, crucial for immune cell trafficking, also play a role in this process.11 Tumors with robust immune infiltration (“hot” tumors) typically respond better to immunotherapy than those with poor infiltration (“cold” tumors). Therefore, strategies to convert cold tumors into hot ones are essential for improving treatment response.12 13 Enhancing CD8+T cell infiltration in the TME while reducing immune suppressive cells, particularly MDSCs, is crucial for overcoming resistance.13 14 MDSCs inhibit CD8+T cells by secreting adenosine,15 itaconate,16 and methylglyoxal,17 leading to immune evasion and resistance to therapy. Thus, targeting MDSCs alongside CD8+T cells offers a promising approach to improve the efficacy of BLCA immunotherapy.
RNA post-transcriptional modifications, particularly N6-methyladenosine (m6A) modifications, play a crucial role in tumor progression.18 19 m6A is the most abundant RNA modification,20 regulating various aspects of RNA metabolism, including splicing, stability, and translation. There are 21 key m6A-regulating genes identified, comprising 7 “writers,” 2 “erasers,” and 12 “readers.”21 “Writers” and “erasers” regulate m6A modification levels, while “readers” mediate m6A-dependent RNA metabolism. m6A modifications are involved in tumorigenesis and remodeling of the TME, including interactions between tumor cells and immune cells.22–24 However, the optimal m6A modification genes for regulating the immune microenvironment in BLCA have yet to be identified, and the mechanisms by which they influence interactions between tumor cells and immune cells remain to be explored.
In this study, we identified METTL3 as a critical target gene in BLCA that synergizes with immunotherapy. We demonstrated that METTL3 regulates the expression and secretion of CXCL5 and CCL5 via m6A modifications, thereby modulating MDSC suppression and promoting CD8+T cell infiltration and activity. Finally, we confirmed that silencing METTL3 or using its inhibitor STM2457 effectively inhibits BLCA progression and enhances the efficacy of ICI therapy.
Materials and methods
Animal models
C57BL/6J mice (4–6 weeks old) were supplied by BIONT (Hubei, China) and maintained under specific pathogen-free conditions at Tongji Hospital.
For the ectopic BLCA model, 1×106 MB49 cells in 100 µL Phosphate-Buffered Saline (PBS) were injected subcutaneously into the dorsal region of each mouse. Tumor size was measured starting from day 6 post-injection, with the endpoint determined based on tumor size. Tumor volume was calculated using the formula: length×width×width×0.52.
For the orthotopic BLCA model, mice were anesthetized with intraperitoneal sodium pentobarbital (50 mg/kg) and maintained under isoflurane (RWD, #R510-22-10) as needed. After disinfection, a 5 mm incision was made in the lower abdomen to expose the bladder. A suspension of 1×106 MB49 cells in 25 µL PBS was injected into the bladder wall, followed by abdominal suturing. Tumor growth was monitored via in vivo bioluminescence imaging with the PerkinElmer IVIS system (Xenogen, USA) 10 min after intraperitoneal injection of D-Luciferin (MCE, #HY-12591A).
For drug treatments, STM2457 (MCE, #HY-12591A) was dissolved in corn oil and administered either intratumorally or intraperitoneally. Anti-mouse Programmed Cell Death Protein 1 (PD-1) antibody (Bioxcell, #BE0146), anti-mouse CD8α antibody (Bioxcell, #BE0061), and anti-mouse Gr-1 antibody (Bioxcell, #BE0075) were also dissolved in PBS and administered intraperitoneally. Dosage and timing details are provided in the figures or figure legends.
Cell culture
The murine MB49 (#JY357, RRID: CVCL_7076) cells were purchased from Jinyuan Biotechnology, HEK293T (#TCH-C101, RRID: CVCL_0063) cells from Haixing Biosciences, and 5637 (#CL-0002, RRID:CVCL_0126) and T24 (#CL-0227, RRID: CVCL_0554) cells from Pricella Biotechnology. MB49 and 293T cells were cultured in Dulbecco's Modified Eagle Medium (DMEM) medium (Pricella, #PM150210), while 5637 and T24 cells were cultured in Roswell Park Memorial Institute (RPMI) 1640 medium (Pricella, #PM150110). All media were supplemented with 10% fetal bovine serum (HyCyte, #FBP-C520) and 1% penicillin-streptomycin (Pricella, #PB180120). All cell lines were authenticated by short tandem repeat profiling or tested for contamination before purchase. During use, the cells are passaged no more than 15 times, and mycoplasma testing is conducted every 2 weeks using the MycAway Plus-Color One-Step Mycoplasma Detection Kit (Yeasen, #40612ES25) to ensure no mycoplasma contamination.
Plasmid construction, lentiviral packaging, and transfection
Short hairpin RNA (shRNA) sequences were designed using the GPP Web Portal and synthesized by Qingke Biotechnology (China). The pLKO.1-puro lentiviral vector (MiaoLingBio, #P0258) was linearized with AgeI-HF (NEB, #R3552S) and EcoRI-HF (NEB, #R3101S), followed by DNA recovery using the FastPure Gel DNA Extraction Mini Kit (Vazyme, #DC301-01). Ligation was performed with Ligation High (TOYOBO, #LGK-101). DH5α was used for the transformation and amplification of plasmids.
For gene overexpression, ORF amplification was conducted using Phanta Max Master Mix (Vazyme, #P515-01) via PCR. The pCDH-CMV-MCS-EF1-Puro lentiviral vector (MiaoLingBio, China, #P1268) was linearized with XbaI (NEB, #R0145S) and recombined with the PCR product using the ClonExpress II One Step Cloning Kit (Vazyme, #C112-01) according to the manufacturer’s protocol.
The correctly sequenced plasmids were then co-transfected with psPAX2 (MiaoLingBio, China, #PP0261) and pMD2.G (MiaoLingBio, China, #P0262) into HEK293T cells using Lipo 293 (Beyotime, #C0521). After 48 hours, the supernatant from HEK293T cells was collected, filtered through a 0.45 µm membrane, and used to transfect MB49 cells. Approximately 72 hours post-transfection, protein and mRNA expression levels were assessed.
Primer sequences used in this study are all provided in online supplemental tables S1 and S2.
Supplemental material
N6-Methyladenosine Methylated RNA Immunoprecipitation (m6A-MeRIP) and transcriptome sequencing
Control or METTL3 knockdown MB49 stable cell lines were used for m6A-MeRIP sequencing and transcriptome sequencing. RNA sequencing, m6A-MeRIP sequencing, and subsequent data analysis were conducted by DIATRE Biotechnology (Shanghai, China).
Single-cell dissociation and flow cytometry analysis
For mouse tumor tissues, residual blood was removed by washing with pre-cooled PBS at 4°C. Tumor tissues were minced into approximately 1 mm³ fragments and digested in a solution containing collagenase IV (1.0 mg/mL; Biosharp, #BS165), hyaluronidase (0.2 mg/mL; Biosharp, #BS171), DNase I (0.1 mg/mL; Biosharp, #BS137), 3% fetal bovine serum, and 1% penicillin/streptomycin in 1640 medium. Digestion was conducted at 37°C for 1 hour, and single-cell suspensions were obtained by passing the digested tissue through a 75 µm mesh.
The single-cell suspensions were initially stained with the Zombie NIR Fixable Viability Kit (Biolegend, #423106) in protein-free PBS at 4°C for 30 min to label dead cells, followed by antibody staining to identify specific cell populations. To assess T cell infiltration and CD8+T cell activity, cells were stained with antibodies against CD45 (BioLegend, #103130, RRID: AB_893339), CD3 (BD Horizon, #562600, RRID: AB_11153670), CD8 (BioLegend, #100707, RRID: AB_312746), Granzyme B (Invitrogen, #25-8898-82, RRID: AB_10853339), and IFNG (Elabscience, #E-AB-F1101E, RRID: AB_3661692). For analyzing MDSC infiltration, cells were stained with CD45, CD11b (BioLegend, #101205, RRID: AB_312788), GR1 (BioLegend, #108440, RRID: AB_2563311), Ly-6G (Elabscience, #E-AB-F1108D, RRID: AB_3661692), and Ly-6C (Elabscience, #E-AB-F1121E). To minimize non-specific binding, TruStain FcX PLUS (BioLegend, #156603, RRID: AB_2783137) was added and incubated on ice for 10 min prior to antibody staining.
RNA extraction and RT-qPCR
Total RNA was extracted from cells using the RNA Quick Extraction Kit (Biology, #BOLG203) to obtain high-quality RNA free of genomic DNA contamination. Reverse transcription was performed using the HiScript III RT SuperMix for qPCR (+gDNA wiper) (Vazyme, #R323-01), and absolute quantification was conducted with the ChamQ Blue Universal SYBR qPCR Master Mix (Vazyme, #Q312-02).
Primer sequences used in this study are all provided in online supplemental table S3.
Western blot
Western blotting was performed to quantify protein expression. Cells were lysed in RIPA buffer (Boster, #AR1194) containing protease inhibitors (MCE, #HY-K0010), followed by sonication and centrifugation. Lysates were mixed with loading buffer (Boster, #AR1112), and equal protein amounts were loaded onto Sodium Dodecyl Sulfate Polyacrylamide Gel Electrophoresis (SDS-PAGE) gels (Seven, #SW143-02) for electrophoresis and subsequently transferred to Polyvinylidene Fluoride (PVDF) membranes (Millipore, #IPVH00010). Membranes were incubated with primary antibodies and Horseradish Peroxidase (HRP)-conjugated secondary antibodies at 4°C. METTL3 antibody (Proteintech, #15073-1-AP, RRID: AB_2142033), AHR antibody (Proteintech, #28727-1-AP, RRID: AB_2918196), HRP-conjugated Goat anti-Mouse (ABclonal, #AS003, RRID: AB_2769851), HRP-conjugated Goat anti-Rabbit IgG antibody (ABclonal, #AS014, RRID: AB_2769854) and Rabbit Control IgG antibody (ABclonal, #AC005, RRID: AB_2771930) were used. Protein bands were visualized using the ECL detection reagent (Absin, #abs9434).
RIP-qPCR
For RNA Immunoprecipitation-Quantitative Polymerase Chain Reaction (RIP-qPCR), the BeyoRIP RIP Assay Kit (Beyotime, #P1801S) was used. Cells were lysed, and the lysate was incubated with Protein A/G agarose pre-bound to specific antibodies for immunoprecipitation. After RNA purification, mRNA abundance was assessed by Reverse Transcription Quantitative Polymerase Chain Reaction (RT-qPCR).
Primer sequences used in this study are all provided in online supplemental table S3.
CHIP-qPCR
Chromatin immunoprecipitation (ChIP) was conducted using the Sonication ChIP Kit (Abclonal, #RK20258) and Protein A/G Magnetic Beads (MCE, #HY-K0202). Protein-DNA crosslinking was performed using 1% formaldehyde, followed by cell lysis and sonication to fragment the DNA. ChIP was carried out, after which DNA-protein complexes were decrosslinked and purified. The abundance of antibody-precipitated DNA was analyzed by RT-qPCR.
Primer sequences used in this study are all provided in online supplemental table S4.
MeRIP-qPCR
m6A-modified RNA was enriched using the EpiQuik CUT&RUN m6A RNA Enrichment (MeRIP) Kit (Epigentek, #P-9018-24) following the manufacturer’s instructions. Total RNA was extracted from cell samples and immunoprecipitated with an m6A-specific antibody. RNA-protein complexes were then cleaved to release RNA fragments. Enriched RNA fragments were purified to remove non-specifically bound RNA, and the m6A-enriched RNA was subsequently analyzed by RT-qPCR.
Primer sequences used in this study are all provided in online supplemental table S5.
RNA degradation assay
RNA synthesis was inhibited by treating cells with actinomycin D (5 µg/mL; MCE, #HY-17559), and cells were collected at 0, 3, and 6 hours. Total RNA was extracted and analyzed by RT-qPCR to assess the degradation rate of target mRNA.
T cell and MDSC chemotaxis assay
Tumor-bearing and non-tumor-bearing C57BL/6J mice were sacrificed by CO2 inhalation. Draining lymph nodes were collected, homogenized, and filtered to obtain single-cell suspensions. CD8+T cells were enriched using the MojoSort Mouse CD8 T Cell Isolation Kit (BioLegend, #480007) and cultured in 1640 medium supplemented with 10% fetal bovine serum (Gibco, #A5669701), with CD3/28 beads (ThermoFisher, #11456D) and IL-2 (MCE, #HY-P7077) to support proliferation.
Spleens were collected, homogenized, and filtered to prepare single-cell suspensions. MDSCs were enriched using the EasySep Mouse MDSC (CD11b+Gr1+) Isolation Kit (Stemcell, #19867) and cultured in RPMI medium with 10% fetal bovine serum (Gibco, #A5669701).
For the chemotaxis assay, CD8+T cells or MDSCs were seeded in the upper chamber of 24-well plates with 8 µm inserts (Corning, #353097) without serum. The lower chamber was filled with serum-free MB49-conditioned medium filtered through a 0.45 µm filter. After 12 hours, cells that migrated to the lower chamber were counted to calculate the migration rate.
ELISA
Secretion levels of CXCL5 and CCL5 were measured using the Mouse CXCL5 ELISA Kit (Elabscience, #E-EL-M0471) and the Mouse RANTES ELISA Kit (Elabscience, #E-EL-M0009), respectively. Cell culture supernatants were collected and filtered through a 0.45 µm filter. Tissue samples were washed, weighed, minced, homogenized, sonicated, and centrifuged. Blood samples were collected in 1.5 mL tubes, allowed to clot at room temperature for 1 hour, and centrifuged. Supernatants were used for ELISA.
Immunohistochemistry
For clinical tissue samples, METTL3 antibody (Proteintech, #15 073-1-AP) was used for immunohistochemistry. Staining and data analysis services were provided by Servicebio Technology (Wuhan, China).
Data analysis
Data are presented as mean±SEM. The two-tailed Student’s t-test or analysis of variance was used. Data were analyzed and visualized using GraphPad Prism V.9.0 (GraphPad Software, San Diego, California, USA).
Result
METTL3 is overexpressed in BLCA and associated with the immunosuppressive microenvironment
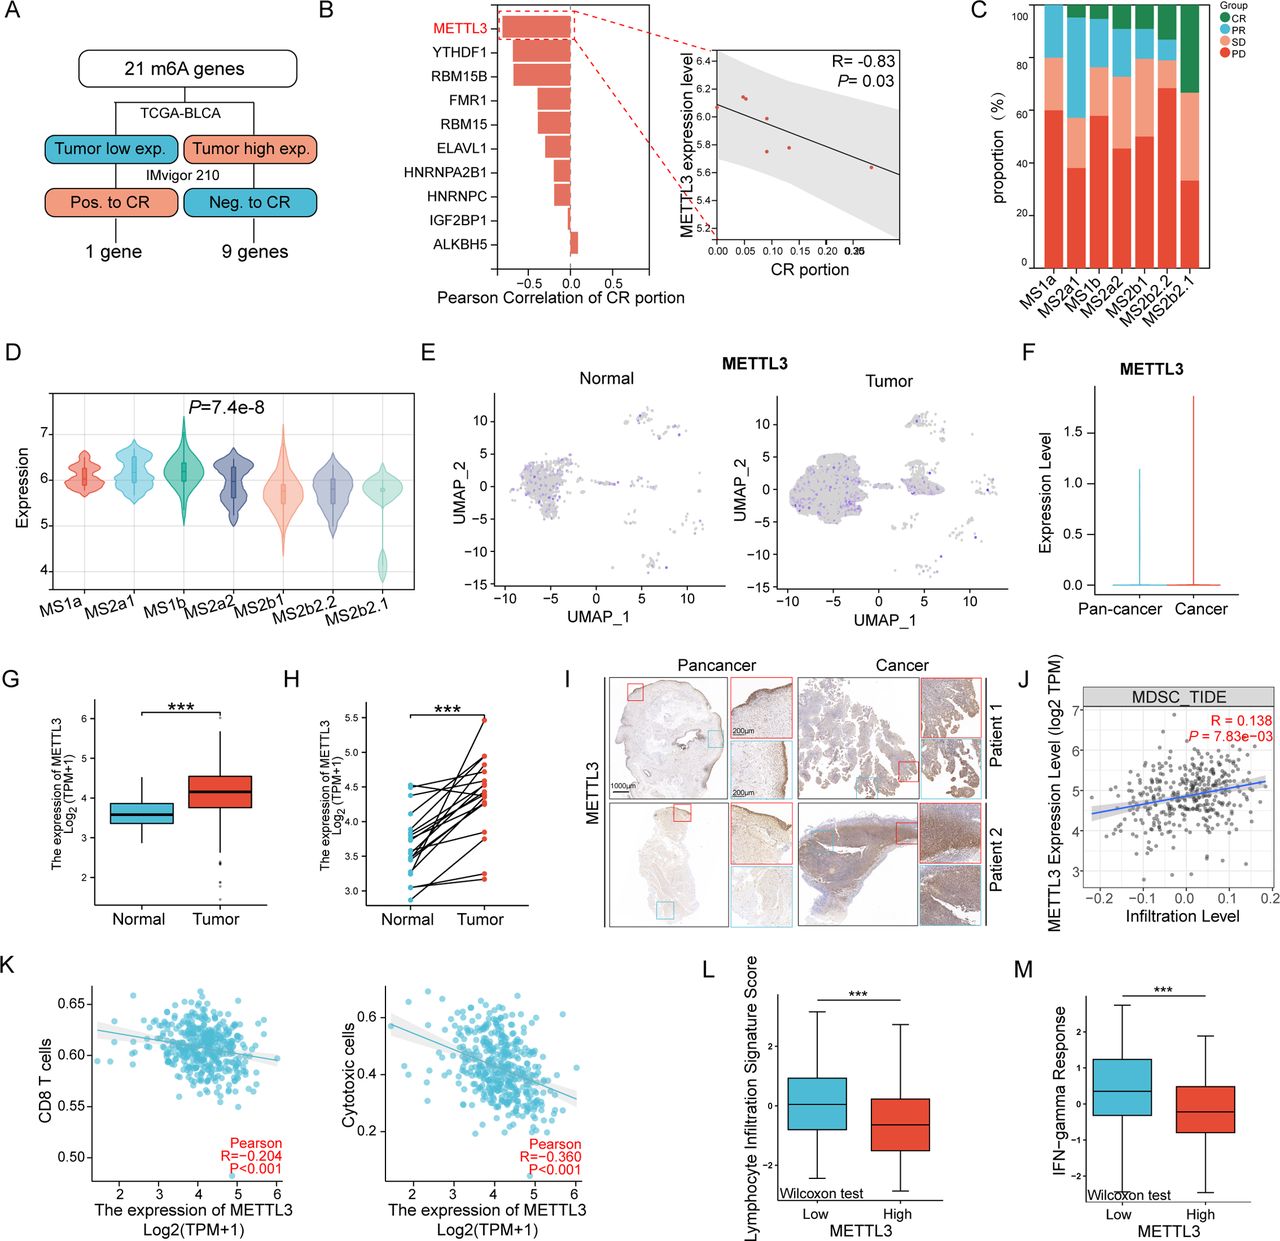
The formation of the tumor immunosuppressive microenvironment is a complex and multifactorial confounding process. Considering that targeting post-transcriptional modifications of RNA may affect multiple molecules simultaneously, we examined 21 RNA m6A modification-associated genes to identify key molecules affecting immunotherapy in BLCA. Through multi-omics data, we found that the expression levels of METTL3 in tumors were the most closely related to poor complete response (CR) rate of immune checkpoint blockades (ICBs) (figure 1A,B). Moreover, in patients with different molecular subtypes, lower METTL3 expression was also associated with a higher proportion of complete response (CR) to ICBs (figure 1C,D). On the other hand, by further analyzing the The Cancer Genome Atlas (TCGA) database and BLCA single-cell sequencing data, we found that the expression of METTL3 was higher in tumor cells compared with adjacent normal cells (figure 1E–H). In line with this, immunohistochemistry staining of clinical samples also confirmed higher METTL3 expression in cancer tissues compared with adjacent tissues (figure 1I). The above data suggested that tumor cells in BLCA might mediate immune escape and decrease the efficacy of ICBs through METTL3 upregulation.

METTL3 is highly expressed in tumors and is associated with an immunosuppressive microenvironment. (A) Flowchart for screening key N6-methyladenosine (m6A) modification genes related to immunotherapy response in bladder cancer (BLCA). (B) Pearson correlation analysis bar chart of the 10 target genes with the percentage of complete response (CR) patients to immunotherapy in the IMvigor210 cohort, and a scatter plot of METTL3 expression level versus CR patient percentage. (C) Proportion of immunotherapy responses among different Lund subtypes in the IMvigor210 cohort. (D) Violin plot of METTL3 expression levels in bladder tissues of patients with different Lund subtypes. (E–F) Expression and statistical analysis of METTL3 in normal and tumor cells from single-cell sequencing of clinical bladder cancer samples. Histogram of METTL3 expression levels in cancer tissues versus adjacent normal tissues in (G) non-paired samples and (H) paired samples from the The Cancer Genome Atlas (TCGA) bladder cancer cohort. (I) Representative immunohistochemistry staining of METTL3 in clinical BLCA samples. (J–K) Scatter plots of METTL3 expression levels with CD8+T cell, cytotoxic cell, and myeloid-derived suppressor cell (MDSC) infiltration levels based on ssGSEA algorithm and TIMER V.2.0 database. (L) Statistical plot of METTL3 expression levels and immune scores in BLCA from the CAMOIP database. *p<0.05; **p<0.01; ***p<0.001.
The efficacy of ICBs is closely related to the infiltration and functional status of T cells. By ssGSEA algorithm and TIMER V.2.0 database, we found a significant negative correlation between METTL3 expression and the infiltration levels of cytotoxic cells and CD8+T cells, and a significant positive correlation with MDSC infiltration (figure 1J,K). In the CAMOIP database, we revealed that patients with higher METTL3 expression had lower levels of lymphocyte infiltration signature and interferon-gamma (IFN-g) response scores (figure 1L,M). Additionally, in the TCGA database, by the ESTIMATE algorithm, we found that compared with other cancers, METTL3 in BLCA exhibited stronger association with immune infiltration; specifically, METTL3 expression levels exhibited the strongest correlation with lower infiltration levels and poorer immune microenvironment (online supplemental figure S1A,B). Moreover, further analysis of molecular expression correlations showed a significant negative correlation between levels of METTL3 expression and the expression of effector molecules of CD8+T cells, such as GZMB, PRF1, and IFNG (online supplemental figure S1C–F). Furthermore, we divided TCGA samples into two groups based on the levels of METTL3 expression, conducted DESeq2 analysis to identify differentially expressed genes, subjected to Gene Ontology (GO) and Kyoto Encyclopedia of Genes and Genomes (KEGG) enrichment analysis and found that lower METTL3 expressed patients showed higher enrichment of pathways related to leukocyte chemotaxis and migration, cytokine response, and CXCR receptor binding (online supplemental figure S1G). In summary, the above analysis of multi-omics of clinical samples illustrated that the elevated expression of METTL3 in BLCA is associated with reprogramming an immunosuppressive microenvironment, leading to poor CR to ICBs.
Supplemental material
Silencing METTL3 restores the immune microenvironment and inhibits tumor progression in BLCA
To validate the findings derived from the above clinical public database, we constructed transgenic MB49 cells, a murine BLCA cell line, by stably knocking down METTL3 or overexpressing METTL3 (figure 2A,B). Subsequently, these different transgenic MB49 cell lines were subcutaneously injected into C57BL/6 mice, respectively, to establish ectopic BLCA models. Tumor growth and TME were then assessed (figure 2C); as expected, we found that silencing METTL3 significantly reduced tumor volumes, while overexpressing METTL3 accelerated tumor progression (figure 2D–F, online supplemental figure S2A–D). More importantly, by flow cytometry, we found that silencing METTL3 led to increased infiltration of CD8+T cells and elevated levels of the effector molecules (GZMB and IFNG) (figure 2G–K, online supplemental figure S2E–I). Additionally, the number of infiltrated MDSCs also decreased significantly in METTL3 silenced tumors (figure 2L, online supplemental figure S2J,K). In agreement, overexpression of METTL3 showed a completely opposite trend, showing a shift toward a tumor-promoting immune-suppressed microenvironment (figure 2G–L). On the other hand, we used STM2457, a specific inhibitor of METTL3, by intratumoral injection; it was found that STM2457 treatment led to decreased tumor volumes (online supplemental figure S3A–D) accompanied by elevated infiltration of CD8+T cells expressing higher levels of IFNG and GZMB (online supplemental figure S3E–J). Finally, in an in situ BLCA model based on the MB49 cell line, we also found that either upregulating or inhibiting METTL3 by genetic methods or its inhibitor, STM2457, consistent with the ectopic model, inhibiting METTL3 resulted in decreased tumor volumes, whereas upregulating METTL3 led to larger tumor volumes (figure 2M–Q, online supplemental figure S3K–N).

Silencing METTL3 inhibits bladder cancer progression by reshaping the tumor microenvironment. (A) Western blot analysis of METTL3 expression levels in MB49 cells. (B) Reverse Transcription Quantitative Polymerase Chain Reaction (RT-qPCR) analysis of METTL3 expression levels in MB49 cells. (C) Schematic of the animal experiment: control, METTL3-silenced, or METTL3-overexpressing MB49 cells were subcutaneously injected into mice, and on day 12, flow cytometry was performed to analyze the tumor immune microenvironment (n=5), along with the assessment of tumor growth in mice (n=5). (D) Images of bladder cancer tumors in mice. (E) Growth curves of bladder cancer tumors in mice. (F) Tumor weights of bladder cancer tumors in mice. (G–L) Analysis results of the immune microenvironment in bladder cancer tumors from mice. (M) Schematic of the in situ bladder cancer model: control, METTL3-silenced, or METTL3-overexpressing MB49 cells were injected into the bladder wall of mice, and in vivo imaging system (IVIS) was used to monitor tumor growth in mice (n=5). (N) IVIS images of in situ bladder cancer tumors. (O) Images of in situ bladder cancer tumors in mice. (P) Tumor volumes of in situ bladder cancer tumors in mice. (Q) Tumor weights of in situ bladder cancer tumors in mice. ns, no significance. *p<0.05; **p<0.01; ***p<0.001.
Then, we used depleting antibody to remove CD8+T cells in tumor-bearing mice and found that the differences in tumor volumes of MB49 cells knocking down METTL3 compared with their wild-type counterparts were obliterated under this condition (online supplemental figure S4A–D). Moreover, after we used anti-Gr1 antibody to remove MDSCs, the tumor volume increase led by overexpression of METTL3 was significantly eliminated (online supplemental figure S4E–H).
The above results suggested that targeting METTL3 could reverse the immunosuppression of the bladder TME and thus inhibit tumor growth.
METTL3 regulates the production of CXCL5 and CCL5 to reprogram the tumor immune microenvironment
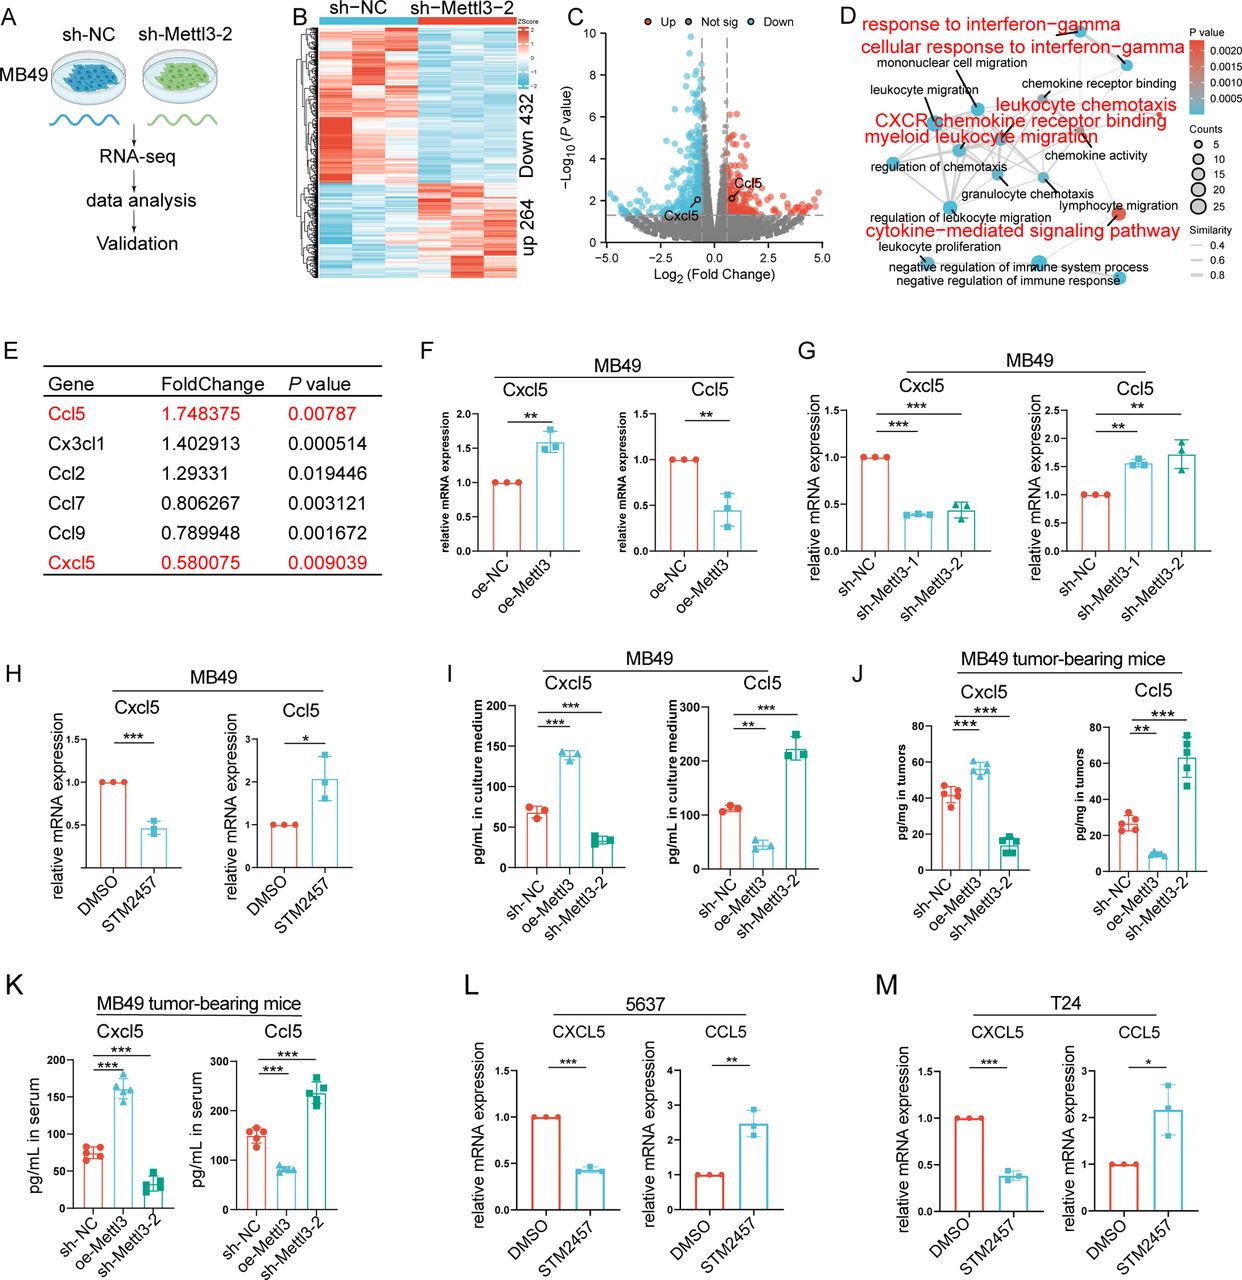
To elucidate the molecular mechanisms by which METTL3 regulates BLCA progression, we performed transcriptomic sequencing on METTL3-knockdown MB49 cells (figure 3A). It was found that silencing METTL3 led to upregulation of 264 genes and downregulation of 432 genes (p<0.05, fold change >1.5 or <0.67) (figure 3B,C). Enrichment analysis indicated that the differentially expressed genes were primarily entangled in pathways such as regulation of chemotaxis, response to IFN-g, cytokine-mediated signaling pathway, and CXCR chemokine receptor binding (figure 3D), which was consistent with the results derived from the TCGA BLCA cohort. Therefore, we speculated that it was through modulating the critical secretome, METTL3, that reshaped the BLCA immune microenvironment and promoted tumor progression. Notably, it was found that CCL5, which attracted CD8+T cells, was increased, while CXCL5, which attracted MDSCs, was downregulated when METTL3 was silenced (figure 3E). Then, we validated these changes derived from RNA sequencing via RT-qPCR (figure 3F,G). Moreover, after treating MB49 cells with STM2457, we also observed an increase in CCL5 expression and decreased levels of CXCL5 (figure 3H). Furthermore, by ELISA, we further found that inhibition of METTL3 by genetic approaches resulted in elevated levels of CCL5 and decreased levels of CXCL5 in the supernatant (figure 3I). We then further verified whether the effects of METTL3 on infiltration of CD8+T cells and MDSCs in tumor were dependent on CCL5 and CXCL5, respectively. Therefore, we evaluated the migration of CD8+T cells or MDSCs using a co-culture system (online supplemental figure S5A,B). As expected, for CD8+T cells, the infiltration was significantly increased after co-culture with conditioned medium from MB49 cells knocking down METTL3; while under the condition of silencing CCL5, the infiltration of CD8+T cells was significantly decreased, and knocking down METTL3 no longer affected the infiltration of CD8+T cells (online supplemental figure S5C,D). For MDSCs, their infiltration was significantly increased after co-culture with conditioned medium from MB49 cells with METTL3 overexpression, while under the condition of silencing CXCL5, the infiltration of MDSCs was significantly decreased, and overexpression of METTL3 no longer affected the infiltration of MDSCs (online supplemental figure S5E–H).

METTL3 regulates the expression and secretion of CXCL5 and CCL5 in bladder cancer. (A) Schematic of the transcriptome sequencing workflow following METTL3 knockdown in MB49 cells. (B) Heatmap of differentially expressed genes after METTL3 knockdown (criteria for differential genes: p<0.05, fold change >1.5 or <0.67. (C) Volcano plot of differentially expressed genes after METTL3 knockdown. (D) Network diagram of GO enrichment analysis of differentially expressed genes. (E) Chemokines with differential expression following METTL3 silencing. (F–G) Reverse Transcription Quantitative Polymerase Chain Reaction (RT-qPCR) analysis of CXCL5 and CCL5 mRNA expression levels following METTL3 overexpression or knockdown in MB49 cells. (H) RT-qPCR analysis of CXCL5 and CCL5 mRNA expression levels in MB49 cells treated with DMSO or STM2457 for 72 hours. (I) ELISA of CXCL5 and CCL5 secretion levels in the culture supernatant of MB49 cell lines; ELISA of CXCL5 and CCL5 levels in (J) mouse tumor tissues and (K) in peripheral blood serum. RT-qPCR analysis of CXCL5 and CCL5 mRNA expression levels in (L) 5637 cells and (M) T24 cells treated with DMSO or STM2457 for 72 hours. *p<0.05; **p<0.01; ***p<0.001.
Then, we sought to verify the regulation modes of METTL3 on CCL5 and CXCL5 in vivo. As expected, in the MB49-dependent, mouse ectopic tumor-bearing model, silencing of METTL3 also led to an increase in CCL5 levels and a decrease in CXCL5 levels intratumorally and in the serum (figure 3J,K). In line with the above data derived from in vitro and in vivo murine systems, upregulation of CCL5 and downregulation of CXCL5 were also observed in human BLCA cell lines 5637 or T24 treated with STM2457 (figure 3L,M).
The above data suggested that METTL3 promoted immunosuppressive TME formation through differential regulation of CCL5 and CXCL5, ultimately driving tumor progression.
METTL3 upregulates CXCL5 via IGF2BP1 in an m6A-dependent manner
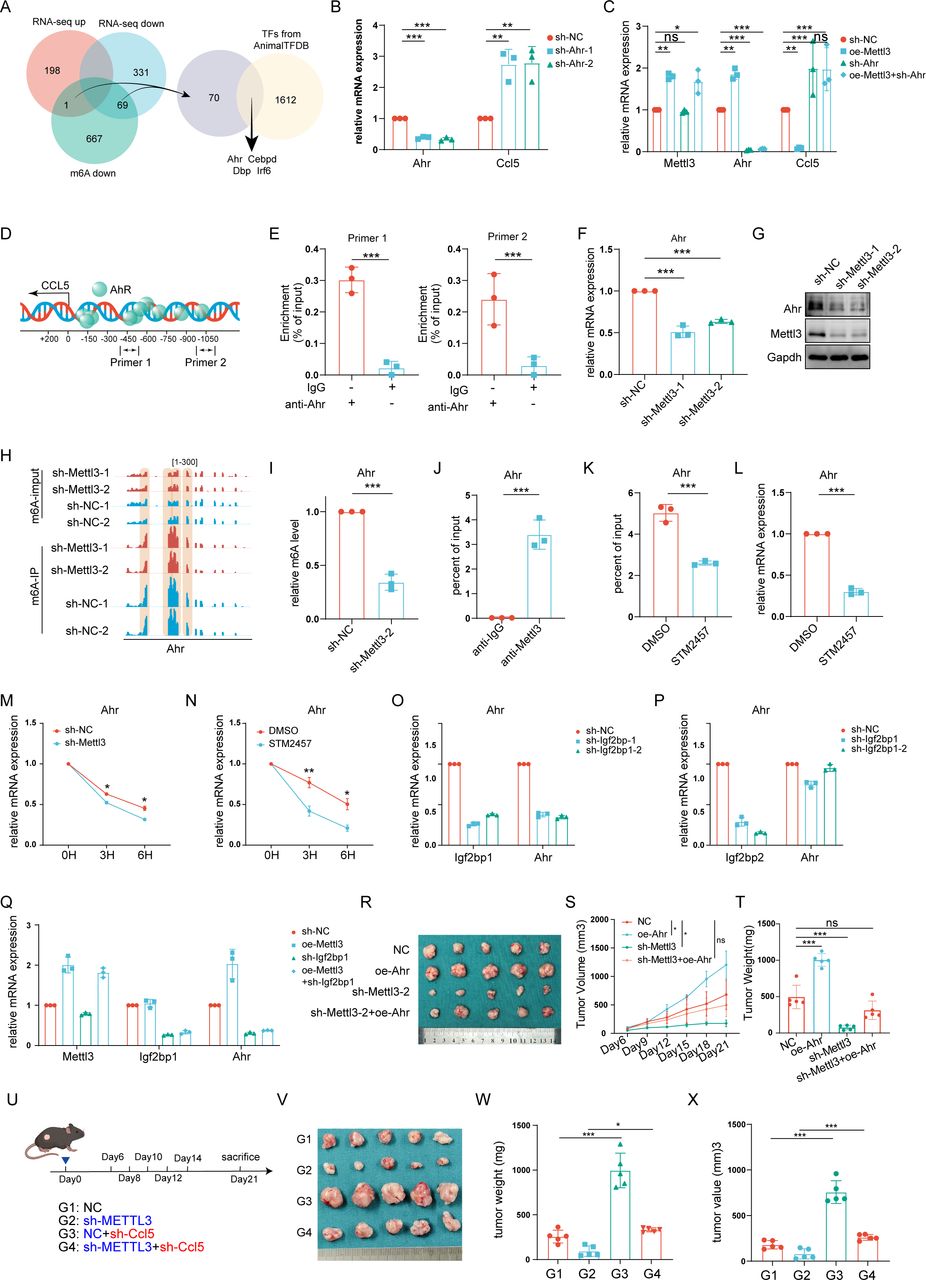
Then we sought to explore the mechanism that METTL3 regulated CCL5 and CXCL5 expression. Considering that METTL3 could mediate the modification of m6A on mRNA, we performed MeRIP sequencing on MB49 cells with knocking down of METTL3 (figure 4A,B). Interestingly, we found a significant decrease in m6A modification on mRNA of CXCL5 rather than CCL5 (figure 4C). Specifically, m6A modification site peak mapping indicated a notable downregulation at the first exon of CXCL5 (figure 4D). Furthermore, by MeRIP-qPCR, we confirmed the decrease of m6A modification at this region of CXCL5 following METTL3 silencing (figure 4E). In line with this, in RIP experiments with METTL3 antibodies, we found that CXCL5 mRNA was significantly enriched (figure 4F). Together, the above results indicated that METTL3 might regulate CXCL5 expression in an m6A-dependent manner.

METTL3 regulates CXCL5 expression through N6-methyladenosine (m6A) modification, thereby promoting myeloid-derived suppressor cell (MDSC) chemotaxis. (A) Schematic diagram of the workflow used for Methylated RNA Immunoprecipitation (MeRIP) sequencing and data analysis in METTL3-knockdown MB49 stable cell lines. (B) Bar chart showing the number of m6A modification sites identified in MeRIP sequencing results. (C) Venn diagram of downstream target gene screening for METTL3, intersecting chemokines significantly altered in RNA sequencing with those showing significant downregulation in m6A modification levels in m6A sequencing. (D) m6A peak map of CXCL5 mRNA modification sites. (E) Bar chart of MeRIP-qPCR results showing the m6A modification level of CXCL5 mRNA in MB49 cells after METTL3 knockdown. (F) RNA Immunoprecipitation (RIP) assay detecting the interaction between METTL3 and CXCL5 mRNA. (G) RNA degradation assay showing CXCL5 mRNA stability after silencing METTL3. (H) RNA degradation assay showing CXCL5 mRNA stability after treatment with METTL3 inhibitor STM2457 (2 µg/mL, 72 hours) in MB49 cells. (I) Reverse Transcription Quantitative Polymerase Chain Reaction (RT-qPCR) analysis of IGF2BP1 and CXCL5 mRNA expression levels in MB49 cells after silencing IGF2BP1. (J) RT-qPCR analysis of IGF2BP2 and CXCL5 mRNA expression levels in MB49 cells after silencing IGF2BP2. (K) RT-qPCR analysis of METTL3, IGF2BP1, and CXCL5 mRNA expression levels in MB49 cells after overexpression of METTL3 and/or silencing of IGF2BP1. (L) Schematic of the animal experiment. (M) Images of bladder cancer tumors in mice. (N) Growth curves of bladder cancer tumors in mice. (O) Tumor weights of bladder cancer tumors in mice. ns, no significance. *p<0.05; **p<0.01; ***p<0.001.
m6A modification upregulates mRNA expression through a variety of mechanisms, by affecting the stability of mRNAs to exert this effect is manifested in several biological processes. By using actinomycin D, a compound that inhibits mRNA synthesis, we found that the half-life of CXCL5 was significantly decreased after silencing METTL3 (figure 4G). In line with this, the half-life of CXCL5 was also significantly shortened under conditions of STM2457 treatment (figure 4H). Then, we sought to identify the key m6A reader which sensed changes in CXCL5 mRNA. Due to the low expression level of IGF2BP3 in the MB49 cell line, we primarily focused on IGF2BP1 and IGF2BP2. By screening, we found that silencing IGF2BP1 abolished the upregulation of CXCL5 led by METTL3 overexpression, whereas interfering with IGF2BP2 did not produce significant effects (figure 4I–K), suggesting that the regulatory effect on CXCL5 by METTL3 was dependent on IGF2BP1. Silencing CXCL5 in tumor cell overexpression of METTL3 led to a significant reduction in tumor volumes, approaching the levels of those derived from wild-type tumor cells (figure 4L–O, online supplemental figure S6A–C).
METTL3 enhances CD8+ T cell infiltration via the AHR-CCL5 axis
Previously, we found that knocking down METTL3 did not down-regulate the levels of m6A modification on CCL5 mRNA. Considering that RNA-binding proteins also regulate mRNA expression by binding directly to mRNA, by RIP experiments, we noticed that METTL3 was not significantly enriched with CCL5 mRNA (online supplemental figure S7A). Therefore, we speculated that the regulation of CCL5 by METTL3 was indirect and sought to further identify transcription factors regulated by METTL3 that suppressed CCL5 expression. Four potential transcription factors, AHR, CEBPD, DBP, and IRF6, were identified by analyzing previous mRNA sequencing data and MeRIP data in cells with METTL3 knocking down the screening criteria as the occurrence of changed mRNA levels and the decrease in the levels of m6A modification (figure 5A, online supplemental figure S7B–H). Afterward, by shRNA, we further screened these four transcription factors and found that the baseline levels of CCL5 were upregulated only with silencing of Aryl Hydrocarbon Receptor (AHR); meanwhile, in this scenario, overexpression of METTL3 no longer downregulated the expression of CCL5, whereas interfering with the other three remaining transcription factors showed no significant effect (figure 5B,C, online supplemental figure S7I–N). Furthermore, by ChIP-qPCR, we confirmed that AHR was enriched in the promoter region of CCL5 (figure 5D,E).

METTL3 regulates bladder cancer progression by chemotactic CD8+T cell infiltration through the IGF2BP1-AHR-CCL5 axis. (A) Venn diagram illustrating the screening process for key transcription factors regulated by METTL3-mediated m6A modification and involved in CCL5 transcription. (B) Reverse Transcription Quantitative Polymerase Chain Reaction (RT-qPCR) analysis of AHR and CCL5 mRNA expression levels after AHR knockdown in MB49 cells. (C) Assessment of CCL5 mRNA expression levels after overexpression of METTL3 and/or knockdown of AHR in MB49 cells. (D) Schematic representation of AHR binding sites within the CCL5 promoter region as predicted by JASPAR. (E) CHIP-qPCR analysis of AHR enrichment at the CCL5 promoter region. (F) mRNA and (G) protein expression levels of AHR after METTL3 knockdown in MB49 cells. (H) Peak plot of m6A modification sites in AHR in MB49 cells. (I) MeRIP-qPCR analysis showing changes in AHR m6A modification levels following METTL3 knockdown in MB49 cells. (J) RIP-qPCR analysis of METTL3 enrichment in AHR mRNA in MB49 cells. (K) MeRIP-qPCR showing changes in AHR m6A modification levels after treatment with the METTL3 inhibitor STM2457 in MB49 cells. (L) RT-qPCR analysis of AHR mRNA levels after STM2457 treatment to inhibit METTL3 in MB49 cells. (M) RNA decay assay showing AHR mRNA stability after silencing METTL3. (N) RNA decay assay showing AHR mRNA stability after treatment with METTL3 inhibitor STM2457 (2 µg/mL, 72 hours) in MB49 cells. (O) RT-qPCR analysis of IGF2BP1 and AHR mRNA expression levels in MB49 cells after silencing IGF2BP1. (P) RT-qPCR analysis of IGF2BP2 and AHR mRNA expression levels in MB49 cells after silencing IGF2BP2. (Q) RT-qPCR analysis of METTL3, IGF2BP1, and AHR mRNA expression levels in MB49 cells after overexpression of METTL3 and/or silencing of IGF2BP1. (R) Images of tumors formed by MB49 stable cell lines (control, AHR overexpression, METTL3 knockdown, METTL3 knockdown with AHR overexpression) subcutaneously implanted into the backs of C57BL/6J mice. (S) Growth curves of mouse bladder cancer tumors. (T) Volume of mouse bladder cancer tumors. (U) Schematic of the animal experiment. (V) Images of bladder cancer tumors in mice. (W) Growth curves of bladder cancer tumors in mice. (X) Tumor weights of bladder cancer tumors in mice; ns, no significance. *p<0.05; **p<0.01; ***p<0.001.
Then, we sought to confirm the regulation of AHR by METTL3. By RT-qPCR and western blot, we found that knocking down METTL3 led to decreased levels of AHR (figure 5F,G). Moreover, through MeRIP-qPCR and RIP-qPCR with anti-METTL3 antibody, we further observed that knocking down of METTL3 resulted in decreased levels of m6A modification on AHR mRNA as well as enrichment of METTL3 on it, suggesting that METTL3 regulated AHR stability in an m6A modification-dependent manner (figure 5H–J). To further confirm the relationship between METTL3 and AHR, we used STM2457 to inhibit METTL3 and found that, consistent with the results of knocking down METTL3, inhibition of METTL3 chemically also led to a decrease in the level of m6A modification on mRNA of AHR, as well as a significant downregulation of its own level (figure 5K,L). Moreover, we further screened the m6A reader against AHR mRNA and found that similar to CXCL5, overexpression of METTL3 also no longer showed effect on AHR only after silencing IGF2BP1 (figure 5M–Q). Therefore, we have established the METTL3-IGF2BP1-AHR-CCL5 axis.
Then, we verified the effect of AHR on CD8+T cell infiltration and found that overexpression of AHR in MB49 cells in the co-culture system eliminated the promotion of CD8+T cell infiltration led by silencing METTL3 (online supplemental figure S8A–C). On the other hand, inhibition of AHR with its inhibitor CH223191 also resulted in increased CD8+T cell infiltration, whereas silencing of CCL5 abolished such effect (online supplemental figure S8D,E). More importantly, in in vivo experiments, overexpression of AHR significantly reversed the decrease in tumor volumes led by knocking down of METTL3 (figure 5R–T). More importantly, further knocking down of CCL5 in METTL3-silenced MB49 cells reversed the tumor suppression effects led by knocking down of METTL3 (figure 5U–X, online supplemental figure S9A–C).
Moreover, we conducted further analysis with public datasets and revealed that in patients with BLCA, METTL3 expression levels were positively correlated with AHR expression (R=0.355), while AHR expression was negatively correlated with CCL5 expression (R=−0.337) (online supplemental figure S10A,B). Additionally, patients with high AHR expression exhibited lower lymphocyte infiltration signature scores and IFN-g response scores, whereas patients with high CCL5 expression showed higher scores in these two categories (online supplemental figure S10C–F). In the IMvigor210 cohort, AHR expression was negatively correlated with the CR rate to ICBs therapy (R=−0.63), whereas CCL5 was positively correlated with it (R=0.44) (online supplemental figure S10G,H). Among different Lund subtypes, as the proportion of patients achieving complete remission after ICB therapy increased, AHR expression levels gradually decreased, while CCL5 expression levels gradually increased (online supplemental figure S10I,J).
Previous studies have identified AHR as a key molecule in the knitting of the immunosuppressive microenvironment, and the above data suggest that METTL3 is key to amplifying this effect.
Targeting METTL3 enhances anti-PD-1 immunotherapy in BLCA
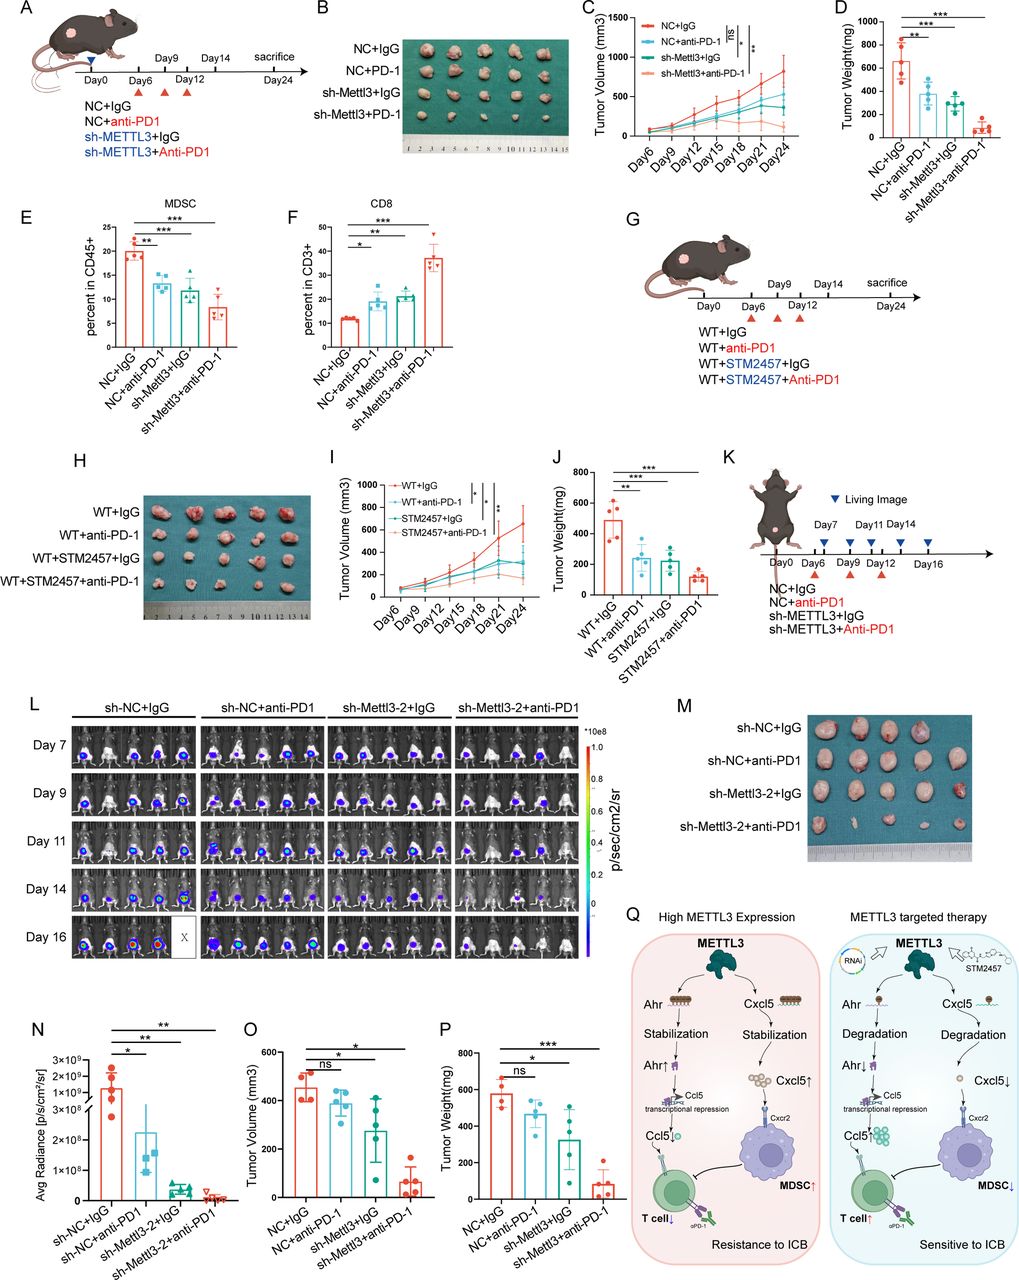
To validate the efficacy of targeting METTL3 in enhancing anti-PD-1 therapy for BLCA, we conducted in vivo experiments. First, we tested whether anti-PD-1 antibody treatment combined with METTL3 silencing could achieve better efficacy; as expected, we found that anti-PD-1 antibody treatment further decreased the tumor volumes under METTL3 silencing (figure 6A–D, online supplemental figure S11A–D). In line with this, anti-PD-1 antibody treatment combined METTL3 silencing further increased CD8+T cell infiltration (figure 6E,F, online supplemental figure S11E–G). Second, we tested the synergetic effect between STM2457 and anti-PD-1 antibody; and as expected, it was found that the combination treatment reduced tumor burden more effectively than STM2457 or anti-PD-1 antibody alone (figure 6G–J). Third, in the orthotopic BLCA model, by using the real-time in vivo imaging system (IVIS) to monitor tumor growth, we found that the combination of METTL3 silencing and anti-PD-1 antibody treatment further suppressed tumor progression, with some mice showing nearly complete tumor regression (figure 6K–P).

Targeting METTL3 enhances the efficacy of anti-Programmed Cell Death Protein 1 (PD-1) immunotherapy in bladder cancer. (A) Control and METTL3-knockdown MB49 stable cell lines were subcutaneously injected into mice. Anti-PD-1 antibody (200 µg/mouse, every 3 days) was administered intraperitoneally starting on day 6. Tumors were harvested on day 12 for flow cytometric analysis of the immune microenvironment (n=5). (B–D) Images, growth curves, and tumor weights of subcutaneous bladder cancer tumors in mice. (E–F) Flow cytometric analysis of MDSCs and CD8+T cell infiltration levels in the tumor tissues of mouse bladder cancer. (G) Wild-type MB49 cells were subcutaneously injected into mice, and on day 6, the mice were randomly divided into groups. Treatment included anti-PD-1 antibody (200 µg/mouse, every 3 days, intraperitoneally), IgG antibody (200 µg/mouse, every 3 days, intraperitoneally), the METTL3 inhibitor STM2457 (250 µg/tumor, once daily, intratumorally), and a combination of STM2457 and anti-PD-1 antibody. (H, J) Images, growth curves, and tumor weights of bladder cancer tumors in mice. (K) Control or METTL3 knockdown MB49 stable cell lines were orthotopically injected into the mouse bladder wall to establish an orthotopic bladder cancer model. Anti-PD-1 antibody (200 µg/mouse, every 3 days, intraperitoneally) or IgG antibody (200 µg/mouse, every 3 days, intraperitoneally) was administered starting on day 6 (n=5). (L) In vivo imaging system (IVIS) Living imaging of tumor growth in the orthotopic bladder cancer model. (M) Images of orthotopic bladder cancer tumors in mice. (N) Statistical analysis of fluorescence signal values from IVIS Living imaging on day 16. (O) Tumor volume in the orthotopic bladder cancer model. (P) Tumor weight in the orthotopic bladder cancer model. (Q) Schematic diagram of the study content. ns, no significance. *p<0.05; **p<0.01; ***p<0.001.
In conclusion, targeting METTL3 regulates the expression and secretion of CXCL5 and CCL5, modulating the infiltration and activity of MDSCs and CD8+T cells in the TME, thereby inhibiting BLCA progression and enhancing the efficacy of anti-PD-1 immunotherapy in BLCA (figure 6Q).
Discussion
m6A modification is the most abundant chemical modification of RNA, playing a critical role in post-transcriptional regulation.18 19 Among the m6A-related genes, METTL3 stands out as a core methyltransferase and one of the most extensively studied genes. Previous studies have demonstrated that METTL3 is broadly involved in tumor progression, including proliferation, invasion, metastasis, angiogenesis, and immune evasion.25 In BLCA, METTL3 has been shown to promote tumor cell proliferation and migration while enhancing angiogenesis, thereby exerting a pivotal role in tumor regulation.26–28 However, BLCA remains a malignancy with a high recurrence rate, especially for muscle-invasive and metastatic BLCAs, where treatment outcomes remain suboptimal.3 4 The advent of immunotherapy has brought new hope to the treatment of BLCA, making it one of the few malignancies that can significantly benefit from ICIs. Nonetheless, the low response rate to ICIs poses a significant challenge. Based on these clinical needs, we aimed to identify novel therapeutic targets to enhance the efficacy of immunotherapy in BLCA. Our analysis of immunotherapy cohorts revealed that METTL3 is the most promising target among m6A-related genes. However, the specific mechanisms through which METTL3 modulates the immune microenvironment and synergizes with immunotherapy remain unclear. In this study, we validated the role of METTL3 in reshaping the BLCA immune microenvironment and demonstrated its potential to enhance immunotherapy through in vitro and in vivo experiments.
The development of ICIs has revolutionized cancer immunotherapy, and immune cells infiltrating the TME are the cornerstone of successful immunotherapy. Among these, CD8+T cells are key effector cells in antitumor immune responses.29 ICIs activate CD8+T cells by relieving inhibitory signals from tumor cells or immunosuppressive cells, thereby restoring their antitumor activity. However, in many tumors, the limited infiltration of immune cells into the TME or the exhaustion of infiltrating immune cells severely restricts the efficacy of ICIs.29 Enhancing immune cell infiltration and alleviating their suppression are effective strategies to overcome these challenges. METTL3 has been shown to play a role in regulating MDSCs and CD8+T cell chemotaxis in various other cancers. In colorectal cancer, METTL3 regulates the migration of MDSCs by modulating the expression of HIFα and BHHE41,30 31 with METTL3 knockout significantly increasing CD8+T cell infiltration and activity. In liver cancer, METTL3 promotes CD8+T cell infiltration via the lncRNA TUG1.32 Our study demonstrated that silencing METTL3 significantly reduces tumor-infiltrating MDSCs while markedly increasing CD8+T cell infiltration. Additionally, the suppression of CD8+T cells by MDSCs is alleviated, leading to a significant enhancement of CD8+T cell activity.16 These findings effectively mitigate the immunosuppressive state of the BLCA microenvironment, providing a stronger foundation for the application of ICIs in BLCA.
To further elucidate the mechanisms underlying this transformation of the tumor immune microenvironment, we investigated changes in chemokines that regulate immune cell infiltration following METTL3 silencing. Our results identified CXCL5 and CCL5 as two critical chemokines. CXCL5 has been extensively implicated in tumor progression, where it promotes invasion, migration, metastasis, angiogenesis, and chemoresistance, contributing to shorter survival times in patients with BLCA.33–36 Furthermore, CXCL5 has been shown to upregulate PD-L1 expression, thereby mediating immune evasion.34 Although efforts to target CXCL5 to inhibit tumor progression are ongoing, no effective inhibitors have been developed to date. On the other hand, CCL5 is predominantly secreted by T cells and natural killer (NK) cells, although emerging evidence suggests that tumor cells can also secrete CCL5. Importantly, CCL5 is a key factor for CD8+T cell infiltration in the TME,37 and increased CCL5 levels have been shown to enhance the efficacy of ICIs in BLCA.38 While significant progress has been made in exploring CCR5 activation, the development of agonists for clinical use requires further time. Meanwhile, the regulation of CCL5 by METTL3 is mediated through AHR. Our previous research has demonstrated that high expression of AHR, whether in tumor cells or immune cells, induces immune evasion, which is closely associated with the degradation of STING and the inhibition of STAT1 signaling.39 40
Thus, targeting upstream regulators of CXCL5 and CCL5 may represent a more feasible approach. Notably, several METTL3 inhibitors, including STM2457, STM3006, and UZH1, have already been developed, with the efficacy and safety of STM2457 being well-validated in multiple studies.41 In BLCA, both METTL3 silencing and STM2457 treatment significantly reduced CXCL5 secretion and increased CCL5 secretion, thereby suppressing MDSC recruitment, enhancing CD8+T cell infiltration, and improving their activity.
In conclusion, targeting METTL3 effectively reshapes the BLCA immune microenvironment and provides a solid foundation for the integration of immunotherapy. In our murine BLCA models, silencing METTL3 or using STM2457 markedly enhanced the efficacy of anti-PD-1 therapy, achieving near-complete tumor regression in some cases. The dual regulatory role of METTL3 in tumor cell behavior and the tumor immune microenvironment, coupled with the availability of mature inhibitory compounds, underscores its strong potential for clinical translation.
Data availability statement
Data are available upon reasonable request. Publicly accessible data, including the TCGA BLCA cohort, can be obtained from Xena (https://xenabrowser.net/datapages/). The IMvigor210 data relevant to BLCA immunotherapy were sourced from the R package IMvigor210CoreBiologies. Single-cell sequencing data were derived from previous publications (GSE135337).
Ethics statements
Patient consent for publication
Ethics approval
This study involves human participants and was approved by Medical Ethics Committee of Tongji Medical College (ID: TJ-IRB202401072). Participants gave informed consent to participate in the study before taking part. Animal experiments were approved by the Laboratory Animal Welfare & Ethics Committee of Tongji Hospital (TJH-202212020) and were conducted in a Specific Pathogen-Free (SPF) environment.
Acknowledgments
All authors express their sincere gratitude for the valuable facilities and assistance provided by the Experimental Medicine Research Center and Animal Center of Tongji Hospital, as well as for the illustration support provided by Biorender.com.
References
Footnotes
YT and ZC contributed equally.
Contributors YT and KT conceived the study. YT and KT wrote the manuscript. ZC, XL, and KT acquired funding. YT, ZC, and JW performed formal analysis and validation. YT, QH and JW conducted investigation and methodology. YT, YH, HS and XL handled visualization and methodology. DX and EP contributed to methodology. ZW, XL, and KT supervised the project and administered resources. KT is the guarantor of the study.
Funding This work was supported by the National Natural Science Foundation of China (Nos. 82170779, 82270804, 82470792, 82472822), Young Elite Scientists Sponsorship Program by CAST (No. YESS20220646), the Natural Science Foundation of Hubei Province (No. 2023AFB867).
Competing interests None declared.
Provenance and peer review Not commissioned; externally peer reviewed.
Supplemental material This content has been supplied by the author(s). It has not been vetted by BMJ Publishing Group Limited (BMJ) and may not have been peer-reviewed. Any opinions or recommendations discussed are solely those of the author(s) and are not endorsed by BMJ. BMJ disclaims all liability and responsibility arising from any reliance placed on the content. Where the content includes any translated material, BMJ does not warrant the accuracy and reliability of the translations (including but not limited to local regulations, clinical guidelines, terminology, drug names and drug dosages), and is not responsible for any error and/or omissions arising from translation and adaptation or otherwise.