Article Text

Abstract
Background The presence of activated CD8 T cells in the tumor microenvironment is correlated with an effective immune response to immune checkpoint inhibitor (ICI) therapy. However, ICI predominantly targets high-affinity T cells, which may be less abundant in tumors with few neoantigens. Targeting the intracellular phosphatase Src homology region 2 domain-containing phosphatase-1 (Shp-1) in combination with ICI lowers the T cell activation threshold and enhances the ability of low-affinity T cells to mount a productive antitumor response.
Methods In this study, we sought to determine whether temporal inhibition of Shp-1 during active tumor growth could rescue the activity of low-affinity T cells specific for endogenous self-antigens. To address this question, we implanted Yale University Mouse Melanoma (YUMM) tumor cell lines into WT mice and, on tumor establishment, administered an inhibitor of Shp-1 (TPI-1) with or without ICI treatment. We analyzed treatment-dependent changes in the immune infiltrate in the tumor via flow cytometry, major histocompatibility complex (MHC) tetramer-mediated detection of tyrosinase-related protein 2 (TRP-2)180–188-specific T cells and a micropipette-based two-dimensional affinity assay to measure the T cell receptor (TCR) affinity.
Results Administration of ICI and a Shp-1 inhibitor to mice with established YUMM tumors, but neither agent alone, resulted in a significant delay in tumor growth and an increased frequency of CD8 tumor-infiltrating T cells with enhanced effector and reduced exhaustion characteristics. In particular, combined treatment increased the frequency of CD8 T cells specific for the MHC Class I-restricted tumor self-antigen TRP-2180–188. We found that the increase in effector T cells was almost entirely due to an increase in T cells with very low TCR affinity.
Conclusions We conclude that approaches for altering TCR signaling threshold are effective in enhancing the antitumor response of low-affinity T cells specific for endogenous self-antigens in settings of ICI resistance and/or where neoantigens are not available to drive antitumor responses.
- Melanoma
- Immunotherapy
- T cell Receptor - TCR
- Immune Checkpoint Inhibitor
- T cell
Data availability statement
Data are available upon reasonable request. All data relevant to the study are included in the article or uploaded as supplementary information.
This is an open access article distributed in accordance with the Creative Commons Attribution Non Commercial (CC BY-NC 4.0) license, which permits others to distribute, remix, adapt, build upon this work non-commercially, and license their derivative works on different terms, provided the original work is properly cited, appropriate credit is given, any changes made indicated, and the use is non-commercial. See http://creativecommons.org/licenses/by-nc/4.0/.
Statistics from Altmetric.com
WHAT IS ALREADY KNOWN ON THIS TOPIC
Immune checkpoint inhibitor (ICI) predominately targets high-affinity CD8 T cells, whereas low-affinity T cells, including those specific for endogenous tumor self-antigens, often have weak effector function. We previously reported that the absence of the tyrosine phosphatase Src homology region 2 domain-containing phosphatase-1 (Shp-1), which regulates T cell receptor (TCR) activation threshold, enhances the activation and antitumor activity of TCR transgenic OT-1 T cells directed towards low-affinity variants of ovalbumin in response to ICIs.
WHAT THIS STUDY ADDS
We now report that in the context of a poor antitumor T cell response and ICI resistance, combined administration of ICI and a Shp-1 inhibitor reduces the growth of established Yale University Mouse Melanoma tumors through the activation, expansion and effector differentiation of very lowaffinity endogenous T cells specific for a tumor self-antigen.
HOW THIS STUDY MIGHT AFFECT RESEARCH, PRACTICE OR POLICY
We propose that targeting low-affinity T cells through modulation of TCR activation threshold represents a potential therapeutic approach for in settings of ICI resistance and/or where neoantigens are not available to drive antitumor responses.
Background
Current treatment for metastatic melanoma includes immune checkpoint inhibitors (ICIs) that target negative T cell costimulatory molecules programmed cell death protein-1 (PD-1) and/or cytotoxic T-lymphocytes-associated protein 4 (CTLA-4).1 2 PD-1- and CTLA-4-based ICI treatment effectively enhances the CD8 T cell immune response to tumor antigens.3 Dysfunction and/or exhaustion of the antitumor effector T cell response contribute to non-responsiveness to ICI treatment,2 as well as inadequate antigen presentation/stimulation and immune regulatory cell populations.4 5 While high-affinity T cells can exert potent antitumor function, they may be absent in the absence of mutation-driven neoantigens or be more susceptible to suppression or exhaustion.6 On the other hand, low-affinity T cells are abundant during many antitumor responses, and there is a need to better understand their contribution to the ICI-induced response.
Self-antigen reactive T cells, which are broadly induced in many cancer types, have lower T cell receptor (TCR) affinity compared with T cells responding to viral antigens.7 While high-affinity T cells may exhibit increased effector functions in the tumor environment as compared with low-affinity T cells, they are more prone to exhaustion.4 Our lab reported that in a B16-Ovalbumin melanoma model, ICI predominantly rescued exhausted OT-1 CD8 tumor-infiltrating lymphocyte (TIL) responding to high-affinity altered peptide ligands (APLs).5 Harnessing low-affinity T cells to respond to tumor antigens, whether responding to neoantigens or self-antigens, may be crucial in controlling poorly immunogenic tumors. Low-affinity T cells infiltrate tumors less efficiently than high-affinity T cells,8 maintain a more stem-like state than highaffinity T cells, and are more resistant to T cell exhaustion.8 Yet low-affinity T cells develop potent effector functions and are frequent participants in many types of immune responses.9 10 Low-affinity CD8 T cells used in adoptive cell therapy for melanoma are capable of robust ICI-induced antitumor responses and, in some cases, exert lower toxicity.11–13
The PD-1 pathway indirectly regulates the TCR signaling pathway by activating phosphatases such as Src homology region 2 domain-containing tyrosine phosphatase-2 (Shp-2) (PTPN11),14 which can then target some elements of the TCR signal. Because PD-1 inhibition of the TCR signal functions downstream of the kinases Zap-70, Lck, and PI3K,15 upstream regulators of TCR signaling may limit the efficacy of blockade of PD-1 and other negative costimulatory molecules. For instance, Src homology region 2 domain-containing phosphatase-1 (Shp-1) is a protein tyrosine phosphatase that regulates the earliest events of TCR signaling,16–18 including activation of Lck and Zap-70. Shp-1 predominately regulates weak TCR signals, as its inhibition is overridden by strong TCR signals.19 20 While Shp-1 inhibitors are approved for human use in non-cancer settings, they retain some activity for other tyrosine phosphatase family members, including Shp-2.19 20 Shp-1 does not localize with PD-1 in T cells in vivo, suggesting its activity may be PD-1-independent.21 Our lab has previously shown that the knockdown of Shp-1 in OT-1 T cells lowers their activation threshold and expands the number of ICI-responsive low-affinity CD8 T cells responding to B16-OVA tumors.5 22 However, it is unknown whether targeting Shp-1 in combination with ICI can rescue exhausted T cells or enhance an already established antitumor T cell response.
To accomplish this, we used Yale University Mouse Melanoma (YUMM) models, which have a low mutation burden and are resistant to ICI treatment.23 The YUMM tumor cell lines are derived from a genetically engineered mouse model with defined mutations commonly seen in human metastatic melanoma, including BRAF.23 We report here that the addition of a Shp-1 inhibitor to an ICI treatment regimen in mice with already established YUMM tumors significantly delayed tumor growth compared with untreated or single-treated controls. Furthermore, the antitumor activity was associated with a substantial increase in effector CD8 T cells specific to a tumor self-antigen. Finally, Shp-1 inhibitor treatment primarily enhanced the response of T cells with low TCR affinity. We conclude that inhibition of Shp-1 combined with ICI treatment enhances the response of low-affinity self-antigen-specific CD8 T cells, leading to tumor control mediated by low-affinity T cells specific to tumor self-antigens.
Methods
Mice
C57BL/6J mice (6–8 weeks old) were purchased from Jackson Laboratories (Bar Harbor, Maine, USA). OT-1 mice were maintained in our mouse colony at the University of Utah. Because YUMM 1.1 and YUMM 5.2 are derived from male mice, recipient male mice were used for tumor experiments. Mice were caged in groups of 5, separated by experimental group. All mouse experiments were performed in accordance with the protocols approved by the University of Utah Institutional Animal Care and Use Committee (IACUC, Protocol #1810).
Tumor production
YUMM lines23 (provided by Dr Martin McMahon, University of Utah, Salt Lake City, Utah, USA) were grown in filtered Dulbecco’s Modified Eagle’s Medium (DMEM):F12 (Thermo Fisher Scientific) containing 10% fetal bovine serum (FBS), 5% non-essential amino acids, and 5% penicillin and streptomycin at 37°C with 5% CO2. All tumor cell lines were thawed from frozen aliquots and cultured in vitro for 7–14 days before injection. C57BL/6 mice received 5×10⁵ YUMM tumor cells in 100 uL phosphate-buffered saline (PBS) in the right hind flank. Tumor volumes were calculated using the formula V=a(b2)/2 (a=tumor length, b=tumor width).24 Mice were randomly assigned to experimental or control groups at the time of tumor visibility.
Antibody and inhibitor treatments
Mice receiving ICI were given intraperitoneal (i.p.) injections of anti-CTLA-4 (200 ug/dose, 9H10, Bio X Cell, Lebanon, New Hampshire, USA) and anti-PD-1 (250 ug/dose, RMP1-14, Bio X Cell) in PBS. Injections were repeated every 3 days until tumor harvest. The Shp-1 inhibitor TPI-1 (MedChemExpress, Monmouth Junction, New Jersey, USA) was stored in Dimethyl sulfoxide at −80°C until use. Prior to injection, a TPI-1 aliquot was diluted with 37°C sterilized water and administered via i.p. injection (0.75 mg per dose, ∼3 mg/kg) every 3 days until tumor harvest.
Cell preparations and flow cytometry
Excised tumors were placed in DMEM+1% FBS, then mechanically disrupted. Tumors were then incubated for 1 hour at 37°C in a mixture of DMEM containing 0.25 mg/mL Collagenase IV (Gibco) and 14.5 ug/mL DNase I (Sigma). After digestion, tumor cells were filtered through a 100 um cell strainer and placed on a Percoll gradient (37.5% Percoll in PBS) (Thermo Fisher Scientific), followed by centrifugation at 2000g. Isolated single-cell suspensions were then washed in DMEM prior to antibody staining. For cell surface antibody stains, cells were incubated with fluorescently conjugated antibodies in flow cytometry staining buffer (PBS+1% FBS) on ice for 15–30 min. For tetramer staining, cells were incubated with PE-conjugated and/or APC-conjugated Kb/tyrosinase-related protein 2 (TRP-2)180–188 tetramer (National Institute of Health (NIH) Tetramer Core Facility, Atlanta, Georgia, USA) for 1 hour on ice. For intracellular transcription factor and Granzyme B staining, cells were permeabilized and stained with transcription factor antibodies using a FoxP3 staining kit (BioLegend, San Diego, California, USA), per manufacturer’s instructions. Phospho-Zap-70 staining was performed by stimulating T cells for 1 min and 30 s using plate-bound anti-CD3e (145–2 C11, BioLegend), permeabilizing with 2% PFA for 20 min, adding ice-cold 100% Methanol for 1 hour, then intracellular staining with FoxP3 buffer. Flow cytometry was performed using the Cytek Aurora full spectrum flow cytometer (Cytek Biosciences) and analyzed with FlowJo V.10.10 (FlowJo, Ashland, Oregon, USA). The following fluorophore-conjugated antibodies used for flow cytometry: anti-CD3 (17A2, BD Biosciences), anti-CD4 (GK1.5, BD Horizon), anti-CD8 (53–6.7, BioLegend), anti-CD44 (IM7, Thermo Fisher), anti-CD45 (30-f11, BioLegend), anti-CD62L (MEL-14, BD), anti-TIM3 (5D12/TIM-3, BioLegend), anti-PD-1 (29F1a2, BioLegend), anti-LY6C (HK1.4, BioLegend), anti-2B4 (M2B4, BioLegend), anti-SLAMF6 (13G3, BD), anti-granzyme B (QA18A28, BioLegend), anti-Tbet (4B10, BioLegend), anti-TCF1 (CD63D9, Becton Dickinson), anti-FOXP3 (FJK-16s, Thermo Fisher), anti-B220 (RA3-6B2, Becton Dickinson), anti-F4/80 (QA17A29, BioLegend), anti-CD11b (M1/70, Becton Dickinson), anti-CD11c (N418, BioLegend), anti-CD19 (6D5, BioLegend), anti-CD103 (AQ17A24, BioLegend), anti-LY6G (1A8, BioLegend), anti-CD80 (16–10 A1, BioLegend), anti-phospho-Zap-70/Syk (n3kobu5, Invitrogen).
Cell sorting
Cells isolated from YUMM tumors were sorted using a BD FACSAria II cell sorter (BD Biosciences) at the University of Utah Flow Cytometry Core Facility. The CD45+ (FITC, 30-F11, Tonbo Bioscience) Thy1.2+ (APC, 53–2.1, eBiosciences) CD4− (BV421, Gk1.5, BioLegend) fraction was sorted in order to leave the CD8 antigen untouched, then checked for CD8 purity post-sort.
Two-dimensional micropipette adhesion frequency assay
We performed this assay as previously detailed.16 This assay functions by using red blood cells (RBCs) coated in various amounts of biotin-LC-NHS (BioVision) with 0.5 mg/mL Streptavidin (Thermo Fisher Scientific) bound to mutated TRP-2180–188 monomer that cannot bind to CD8, (NIH Tetramer Core Facility).9 25 T cells are brought into contact with RBCs coated in major histocompatibility complex (MHC) bound to TRP-2 antigen for a set amount of time at a specific area of contact. Binding can be observed with RBC elongation on T cell retraction. This is repeated 50 times to determine the frequency of adhesion. If binding is observed, the T cells are also tested against an irrelevant monomer (OVA257–264) to ensure antigen specificity for TRP-2. After antigen specificity has been determined, the assay is repeated with RBCs with varying amounts of antigen density to determine two-dimensional affinity. Relative two-dimensional affinity was calculated using the formula: Contact area (Ac) × Ka (two-dimensional binding affinity) − ln(1 − adhesion frequency (¥)/TCR and pMHC density) = relative two-dimensional affinity.9 This was calculated for T cells that had an adhesion frequency greater than 10%.
Statistical analysis
We used t-tests (when comparing two groups) and one-way analysis of variance (when comparing more than two groups) to determine significant statistical differences using Prism software (GraphPad V.10.2.3). Differences in tumor growth were compared by calculating area under the curve for the individual growth curve for each mouse. Significant p values were marked as *p<0.05, **p<0.01, ***p<0.001, ****p<0.0001. Studies were not blinded. To determine appropriate group sizes, we performed power analysis using the G*Power software available as a free download from the University of Dusseldorf. We estimated the number of animals needed to observe a significant 30–50% difference between the mean of two samples in a paired t-test with SD of 20%.
Results
YUMM tumor lines induce reproducible tumor immune microenvironments
To characterize tumor microenvironments (TMEs) resistant to ICI, we used YUMM 1.1 (Braf V600E/Pten −/− Cdkn2 −/−) and YUMM 5.2 (Braf V600E/Trp53 −/−) cell lines.23 We injected YUMM 1.1 or YUMM 5.2 melanoma cells subcutaneously into the right rear flank of wildtype C57BL/6 mice. By day 21 we found that YUMM 1.1 and YUMM 5.2 tumors exhibited distinct in vivo growth kinetics (figure 1A). On identification of CD8 and CD4 TIL in the tumors (online supplemental figure S1A), we observed that the reduced growth rate of YUMM 1.1 corresponded to an increased frequency of both populations, as compared with YUMM 5.2 tumors (figure 1B). YUMM 5.2 tumors had fewer regulatory T cells (Tregs, CD4+FoxP3+) (figure 1B). However, this was proportional to the frequency of CD8 TIL, with similar CD8 to Treg ratios in each tumor type (figure 1B).
Supplemental material

Inhibition of Shp-1 combines with ICI to inhibit YUMM tumor growth. (A) YUMM 1.1 or 5.2 cells were injected subcutaneously (s.c.) into the right rear flank of wildtype C57BL/6 mice. Tumor length and width were measured at various stages of tumor growth. Growth curves indicate tumor volume at each time point. (B) Bar graphs indicate the frequency of CD8 T cells, CD4 T cells and Tregs of total CD45+T cells isolated from the tumor, as determined by flow cytometric analysis, in both YUMM 1.1 (black) and YUMM 5.2 (blue) at day 21 of tumor growth. An additional bar graph indicates the ratio in the frequency of CD8 T cells to Tregs (n=10 mice per group, *p<0.05, **p<0.01, ***p<0.001). (C) Mice bearing YUMM 1.1 or YUMM 5.2 tumors were treated intraperitoneally (i.p.) with TPI-1 in combination with ICI (anti-PD-1 and anti-CTLA), or singly with either TPI-1 or ICI, every 3 days beginning at the time of tumor visibility (day 7–10). Graphs show tumor volume over time. Statistical significance was determined using a one-way ANOVA of the area under the curve (AUC). Results are representative of three independent experiments. (D) Graphs show differences in tumor volume at day 23 (YUMM 1.1) or day 20 (YUMM 5.2). Statistical significance was determined using a one-way ANOVA of the area under the curve (AUC) of tumor volume measurements over time (for C) or of the mean tumor volume of an individual time point (for D). (n=7–10 mice per group, **p<0.01, ***p<0.001, ****p<0.0001). ANOVA, analysis of variance; CTLA, cytotoxic T-lymphocytes-associated protein; ICI, immune checkpoint inhibitor; ns, not significant; PD-1, programmed cell death protein-1; Shp-1, Src homology region 2 domain-containing phosphatase-1; Treg, regulatory T cells; YUMM, Yale University Mouse Melanoma.
We also measured the frequency of myeloid-derived suppressor cells (MDSC) by measuring the frequency of myeloid cells (CD11b+) with a monocytic (Ly6ChiLy6G-, M-MDSC) or neutrophilic (Ly6CloLy6G+, Polymorphonuclear (PMN)-MDSC) phenotype (online supplemental figure S1B). We also evaluated the frequency of MHC Class II-expressing macrophages (F4/80+) and both myeloid-derived (MHCII+CD11b+CD11c+) and lymphoid-derived (MHCII+CD11b-CD11c+) dendritic cell (DC) subsets (online supplemental figure S1C,D). While all these myeloid populations were readily detected, no significant differences were observed when comparing YUMM 1.1 to YUMM 5.2 tumors (online supplemental figure S2).
Administration of TPI-1 in combination with ICI delays the growth of established YUMM tumors
Our previous work showed that T cell-intrinsic loss of Shp-1 enhanced the response of low-affinity T cells specific for B16 melanoma.5 We sought to determine whether targeting Shp-1 with an inhibitor could rescue the antitumor activity of an already established immune response during active tumor growth. To test this, we employed a commercially available Shp-1 inhibitor, TPI-1. In vitro administration of TPI-1 in Jurkat cells increases the phospho-substrates of Shp-1, such as Lck and Zap-70, while having little to no effect on Shp-2 substrates.26 Similarly, in our hands, TPI-1 enhanced early Zap-70 phosphorylation in primary T cells (online supplemental figure S3). TPI-1 also demonstrates in vivo antitumor activity in the B16 model system.26 To determine whether targeting Shp-1 in combination with ICI is beneficial in controlling established YUMM tumors, we administered ICI (anti-PD-1 + anti-CTLA-4), TPI-1 (Shp-1i), or both. While ICI or Shp-1i treatment alone had little effect on tumor growth (figure 1C,D), combined treatment significantly delayed the growth of YUMM 1.1 and YUMM 5.2 tumors (figure 1C,D).
Combined ICI+Shp-1i increases intratumoral effector CD8 T cells
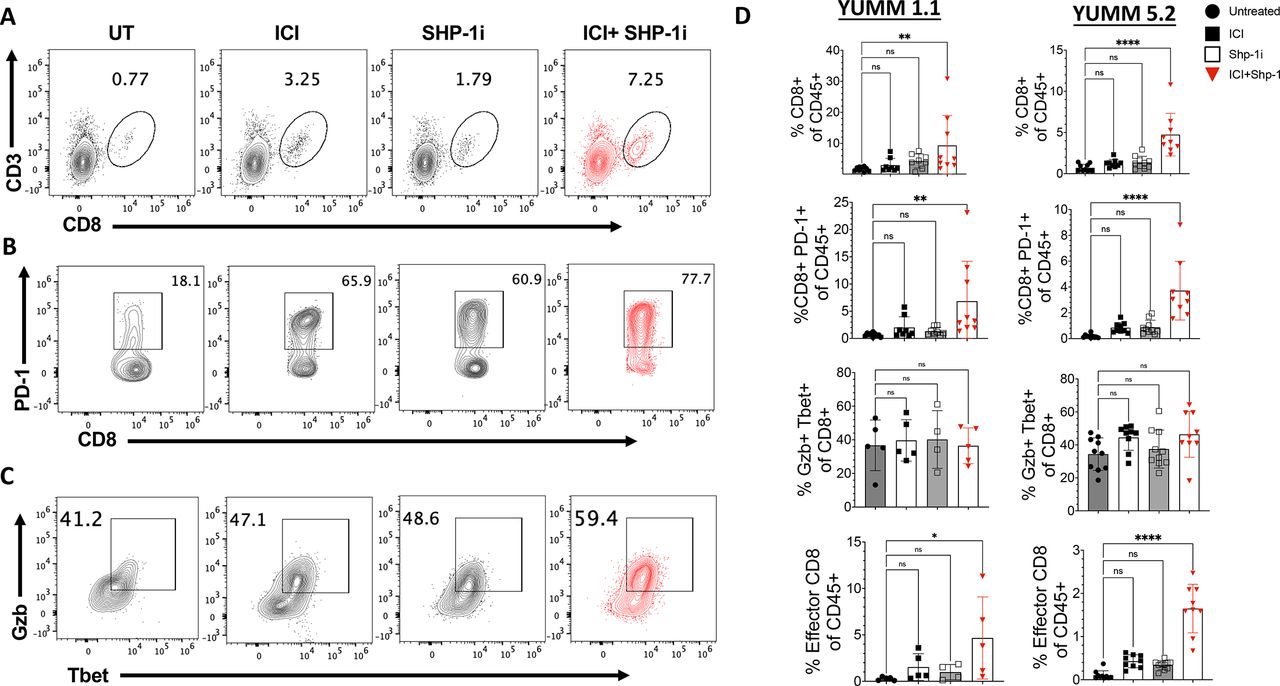
We next measured the presence of CD8 T cells in YUMM tumors at day 21 of tumor growth. Flow cytometric analysis showed a significant increase in the frequency of intratumoral CD8 T cells in mice receiving ICI+Shp-1i combination treatments but not ICI or Shp-1i alone, as compared with untreated controls (figure 2A–D). CD8 T cell activation was enhanced in ICI+Shp-1i treated mice, as demonstrated by an increased frequency of PD-1-expressing T cells in both YUMM 1.1 and 5.2 tumors (figure 2B–D). Additionally, the absolute count and density of activated CD8 TIL significantly increase in ICI+Shp-1i treated mice in both tumor models (online supplemental figure S4). To investigate if ICI+Shp-1i promoted CD8 T cell effector function, we measured the frequency of T cells coexpressing Granzyme B and the transcription factor T-bet. T-bet and Granzyme B coexpression is associated with effector T cell differentiation and function. When gating on CD8 T cells in the tumor, we observed a modest but not statistically significant increase in the proportion of CD8 TIL coexpressing granzyme B and T-bet after ICI+Shp-1i combined treatment (figure 2C). However, due to the overall increase in CD8 TILs, the frequency of effector CD8 T cells expressing PD-1+, Gzb+, and T-bet+ significantly as a proportion of total CD45+significantly increased in both tumors (figure 2C,D).

ICI+Shp-1i induces the presence of effector CD8 T cells in YUMM tumors. YUMM 1.1 and YUMM 5.2 tumors were established in C57BL/6 mice as in figure 1. Representative flow plots indicate the frequency of (A) CD8+CD3+ (gated on live CD45+cells), (B) CD8+PD-1+ cells (gated on live CD45+CD8+ cells), and (C) T-bet+Granzyme B (GzB)+cells (gated on live CD8+CD3+) isolated from YUMM 5.2 tumors at day 21 of tumor growth. Mice were treated with ICI alone, Shp-1i alone, ICI+Shp-1i, or were untreated (UT), as in figure 1. (D) Bar graphs indicate the frequency of CD8+CD3+ (of live CD45+cells), CD8+PD-1+ cells (of live CD45+cells), T-bet+GzB+ cells (of CD8+cells) and T-bet+GzB+ cells (“Effector CD8”), of live CD45+isolated from YUMM 1.1 and 5.2 tumors at day 21 of tumor growth in the indicated treatment groups. Statistical analysis was performed using one-way ANOVA (n=5–10 mice per group, **p<0.01, ****p<0.0001). Results are representative of two independent experiments. ANOVA, analysis of variance; ICI, immune checkpoint inhibitor; ns, not significant; PD-1, programmed cell death protein-1; Shp-1, Src homology region 2 domain-containing phosphatase-1; UT, untreated;YUMM, Yale University Mouse Melanoma.
ICI+Shp-1i treatment alters tumor-infiltrating myeloid cells but not Tregs
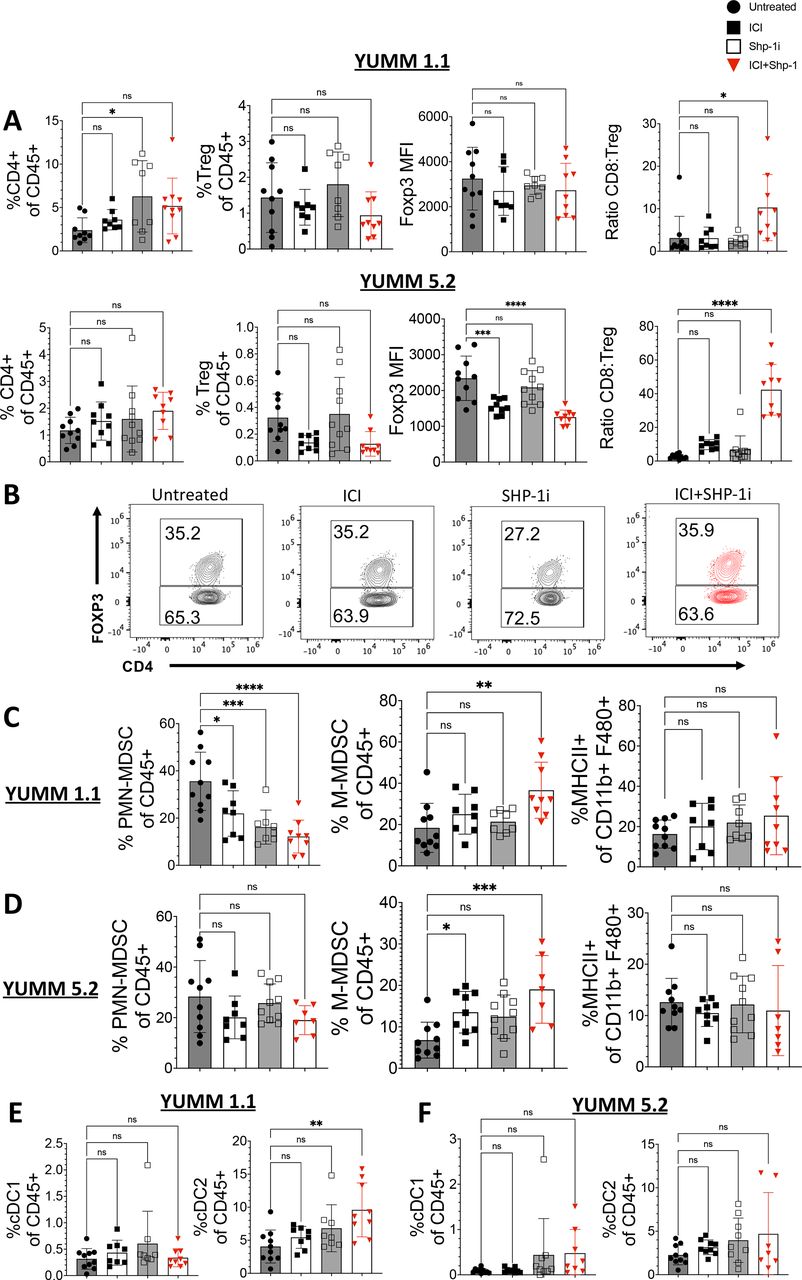
Because the inhibitor may impact multiple hematopoietic cell types, we expanded our analysis to include other immune cell subsets. Shp-1 deletion in Tregs has been shown to impair their function, leading to decreased control of inflammation.27 The frequency of total CD4 T cells and Tregs remained unaltered in both YUMM 1.1 and YUMM 5.2 tumors after ICI+Shp-1i, with no alteration in FoxP3 expression levels (figure 3A,B). The ratio of effector CD8 T cells to Tregs increased (figure 3A), largely due to the expansion of effector CD8 T cells in tumors rather than a decrease in Tregs. In some studies, FoxP3 expression levels correspond to Treg activity. In YUMM 5.2 tumors combined treatment, but not Shp-1i treatment alone, resulted in a significant decrease in FoxP3 mean fluoresence intensity (MFI) (figure 3A). In contrast, in YUMM 1.1 tumors there was no significant change in Foxp3 MFI for any treatment group (figure 3A). These studies suggest that the primary effect of Shp-1i treatment on antitumor T cells is in the expansion of effector T cells, rather than a reduction in Treg abundance or activity.

ICI+Shp-1i does not increase the frequency of CD4 T cells or FoxP3-expressing Tregs in YUMM tumors. Flow cytometry analysis of infiltrating CD45+cells was performed for YUMM 1.1 and 5.2 tumors harvested at day 21. (A) Bar graphs indicate the frequency of CD4+CD3+ (of live CD45+cells) and CD4+FoxP3+ (Treg) cells (of live CD45+cells), MFI of Foxp3 among CD4 TIL, as well as the ratio of CD8+CD3+ T cell to Treg frequency for YUMM 1.1 and 5.2 tumors at day 21 of tumor growth in the indicated treatment groups. (B) Representative flow plots indicate the frequency of FoxP3-expressing CD4 T cells (gated on CD4+CD3+CD45+) in YUMM 1.1 tumors. (C–D) Bar graphs indicate the frequency of M-MDSC (CD11b+LY6ChiLy6Glo, gate on CD45+), PMN-MDSC (CD11b+LY6CloLy6Ghi, gate on CD45+), and M1-Macrophages (MHCII+CD11b+F480+) in the indicated treatment groups in (C) YUMM 1.1 and (D) YUMM 5.2 tumors. (E–F) Bar graphs indicate the frequency of cDC1 (CD11c+CD11b- CD103+) and cDC2 (CD11c+CD11b+MHCII+ F4/80-) in (E) YUMM 1.1 and (F) YUMM 5.2 tumors. Statistical analysis was performed using one-way ANOVA (n=7–10 mice per group, *p<0.05, **p<0.01, ***p<0.001, ****p<0.0001). Results are representative of two independent experiments. ANOVA, analysis of variance; ICI, immune checkpoint inhibitor; MDSC, myeloid-derived suppressor cell; MFI, mean fluoresence intensity; PMN, polymorphonuclear;MHC, major histocompatibility complex; ns, not significant; Shp-1, Src homology region 2 domain-containing phosphatase-1; TIL, tumor-infiltrating lymphocyte; Treg, regulatory T cells; YUMM, Yale University Mouse Melanoma.
While PMN-MDSCs were significantly reduced in YUMM 1.1 tumors after ICI+Shp-1i, no significant changes were observed in YUMM 5.2 tumors. In contrast, M-MDSCs were modestly but significantly increased in both tumor types following treatment (figure 3C,D). We found that combined treatment increased the frequency of CD11b+F480+ macrophages in both tumor models (online supplemental figure S5A). When we further assessed the frequency of MHC Class II-expressing macrophages (CD11b+F480+), we found that combined treatment induced a significant increase in YUMM 1.1 but not YUMM 5.2 tumors (online supplemental figures S3D and S5A). Lastly, we measured the presence of both lymphoid (CD11b-CD11c+CD103+) and myeloid (CD11b+CD11c+CD103−) DC subsets in the tumor. We observed no significant changes in lymphoid DCs (cDC1) in response to treatment and an increase in myeloid-derived DCs in YUMM 1.1 tumors only after combined treatment (figure 3E,F). We concluded that the most consistent and profound change in the TME in response to combined treatment across both tumor models was within the CD8 T cell compartment.
ICI+Shp-1i increases the frequency of non-exhausted CD8 TILs
While activated T cells express PD-1, T cell exhaustion is characterized by the coexpression of additional inhibitory proteins, such as Lag-3, 2B4, and Tim-3, that combine with PD-1 to dampen TCR signal strength and blunt the T cell effector response.28 29 To assess the activation status of CD8 TIL following treatment, we measured the frequency of CD8 T cells coexpressing PD-1 and 2B4. Flow cytometry data from day 21 YUMM tumors revealed that while ICI+Shp-1i treatment had modest effects on the proportion of PD-1+2B4+ CD8 TIL, the frequency of activated CD8 TILs expressing PD-1 without 2B4 was significantly increased (figure 4A–C).

ICI+Shp-1i alters the frequency of activated and exhausted phenotype CD8 T cells in the tumor. Flow cytometry analysis of infiltrating CD45+cells was performed for YUMM 1.1 and 5.2 tumors harvested at day 21. (A) Representative flow plots indicate expression of 2B4 and PD-1 expression from both YUMM 1.1 (upper panel) and YUMM 5.2 tumors (lower panel), gated on live CD45+CD3+ CD8+ cells. (B) Bar graphs show frequency of PD-1+2B4 and PD-1+2B4+ in YUMM 1.1 tumors as a percentage of CD8+CD3+ T cells or total live CD45+cells. (C) Bar graphs show frequency of PD-1+2B4 and PD-1+2B4+ in YUMM 5.2 tumors as a percentage of CD8+CD3+ T cells or total live CD45+cells. Statistical analysis was performed using one-way ANOVA (n=7–10 mice per group, *p<0.05, **p<0.01, ****p<0.0001). Results are representative of two independent experiments. ANOVA, analysis of variance; ICI, immune checkpoint inhibitor; ns, not significant; PD-1, programmed cell death protein-1; Shp-1, Src homology region 2 domain-containing phosphatase-1; UT, untreated; YUMM, Yale University Mouse Melanoma.
ICI + Shp-1i increases the frequency of CD8 effector T cells specific toward the tumor self-antigen TRP-2180–188
Our prior work showed that ICI predominately enhanced the activity of high-affinity CD8 T cells, whereas the combination of ICI and T cell-intrinsic Shp-1 knockdown enhanced the activity of both high-affinity and low-affinity T cells.5 TCRs specific for self-antigens have lower TCR affinity than those specific for foreign antigens.7 Therefore, we hypothesized that Shp-1i would enhance the response of T cells specific to tumor self-antigens. We measured changes to CD8 TIL able to bind tetramers specific for a known self-antigen, TRP-2 (TRP-2180–188, restricted to H-2Kb) (NIH Tetramer Core Facility, Atlanta, Georgia, USA). TRP-2 is involved in melanogenesis and, in both mouse and human melanomas, induces tumor-reactive CD8 T cell responses.30 To measure T cell responses in YUMM tumors to this endogenous self-antigen, we used TRP-2180–188 tetramer (NIH Tetramer Core Facility, Atlanta, Georgia, USA). While TRP-2 tetramer-binding CD8 TILs were readily detected in both tumor types (online supplemental figure S6A), a large fraction failed to express PD-1 (figure 5B–D). The frequency of total and PD-1-expressing TRP-2-specific T cells significantly increased in response to ICI+Shp-1i treatment (figure 5B–D), with a lower fraction of TRP-2+PD-1+ CD8 TIL coexpressing 2B4 in YUMM 1.1 tumors (figure 5E and online supplemental figure S6B). While changes in CD8 expression are an indicator of recent cognate activation in viral models, we see no consistent decrease in CD8 MFI in response to treatment among (online supplemental figure S7).31

ICI+Shp-1i increases the frequency of TRP-2-specific CD8 TIL. Flow cytometry analysis of infiltrating CD45+cells was performed for YUMM 1.1 and 5.2 tumors harvested at day 21. (A) Representative flow plots indicate the frequency of CD8 TIL in YUMM tumors showing dual binding to H-2Kb/TRP-2180–188 tetramers (TRP-2+) conjugated to PE or APC (right plot), as compared with unstained control cells (left plot). (B) Representative flow plots show tetramer binding by CD8+CD3+ TIL in YUMM 1.1 tumors at day 21 following the indicated treatments. (C) Bar graphs indicate the frequency of total TRP-2+, TRP-2+PD-1+ and TRP-2+PD-1− CD8 TIL of CD45+cells in both YUMM 1.1 and YUMM 5.2 under the indicated treatment conditions. (D) Representative flow plots indicate expression of PD-1 and binding to tetramer by CD8 TIL in both YUMM 1.1 and YUMM 5.2 under the indicated treatment conditions. (E) Representative histograms indicate expression of 2B4 by PD-1+TRP-2+ CD8 TIL in both YUMM 1.1 and YUMM 5.2 under the indicated treatment conditions. Statistical analysis was performed using one-way ANOVA (n=7–10 mice per group, *p<0.05, ****p<0.0001). Results are representative of two independent experiments. ANOVA, analysis of variance; APC, allophycocyanin; ICI, immune checkpoint inhibitor; PD-1, programmed cell death protein-1; PE, phycoerythrin; Shp-1, Src homology region 2 domain-containing phosphatase-1; TIL, tumor-infiltrating lymphocyte; TRP-2, tyrosinase-related protein 2; UT, untreated; YUMM, Yale University Mouse Melanoma.
ICI + Shp-1i skews CD8 TRP-2-specific T cells to T-bethi TCF-1lo effector phenotype
TCF-1 is a transcription factor expressed by naïve and memory T cells, but downregulated by effector T cells.32 In tumor settings, it marks a population of stem-like T cells that do not express effector functions but may be recruited into the response following ICI treatment. Flow cytometric analysis of day 21 YUMM tumors revealed that ICI+Shp-1i increased the frequency of T-bet-expressing (figure 2C) and decreased the frequency of TCF-1-expressing (figure 6C) total CD8 T cells and TRP-2+PD-1+ CD8 T cells (figure 6B,C). TRP-2+PD-1- CD8 T cells were predominantly T-betlo TCF1hi. However, in YUMM 5.2 ICI+Shp-1i treated mice, this population increased T-bet expression and decreased TCF-1 despite remaining PD-1 negative (figure 6A–C). Overall, these results indicate that ICI+Shp-1i induces the formation of a robust effector T cell response specific for a self-antigen.

Effector phenotype TRP-2+cells are induced following ICI+Shp-1i treatment. Flow cytometry analysis of infiltrating CD45+cells was performed for YUMM 1.1 and 5.2 tumors harvested at day 21. Representative flow plots indicated expression of TCF-1 and Tbet by (A) TRP-2+PD-1– CD8+cells and (B) TRP-2+PD-1– CD8+cells in YUMM 1.1 and YUMM 5.2 tumors in the indicated treatment groups. (C) Bar graphs indicate the frequency of T-bethi TCF-1lo cells among TRP-2+PD-1+ CD8 T cells (left) and TRP-2+PD-1– CD8 T cells (right) for both YUMM 1.1. Statistical analysis was performed using one-way ANOVA (n=7–10 mice per group, *p<0.05, ***p<0.001, ****p<0.0001). Results are representative of two independent experiments. ANOVA, analysis of variance; ICI, immune checkpoint inhibitor; PD-1, programmed cell death protein-1; Shp-1, Src homology region 2 domain-containing phosphatase-1; TRP-2, tyrosinase-related protein 2; UT, untreated; YUMM, Yale University Mouse Melanoma.
ICI+Shp-1i enhances the low affinity CD8 T cells responding to YUMM tumors
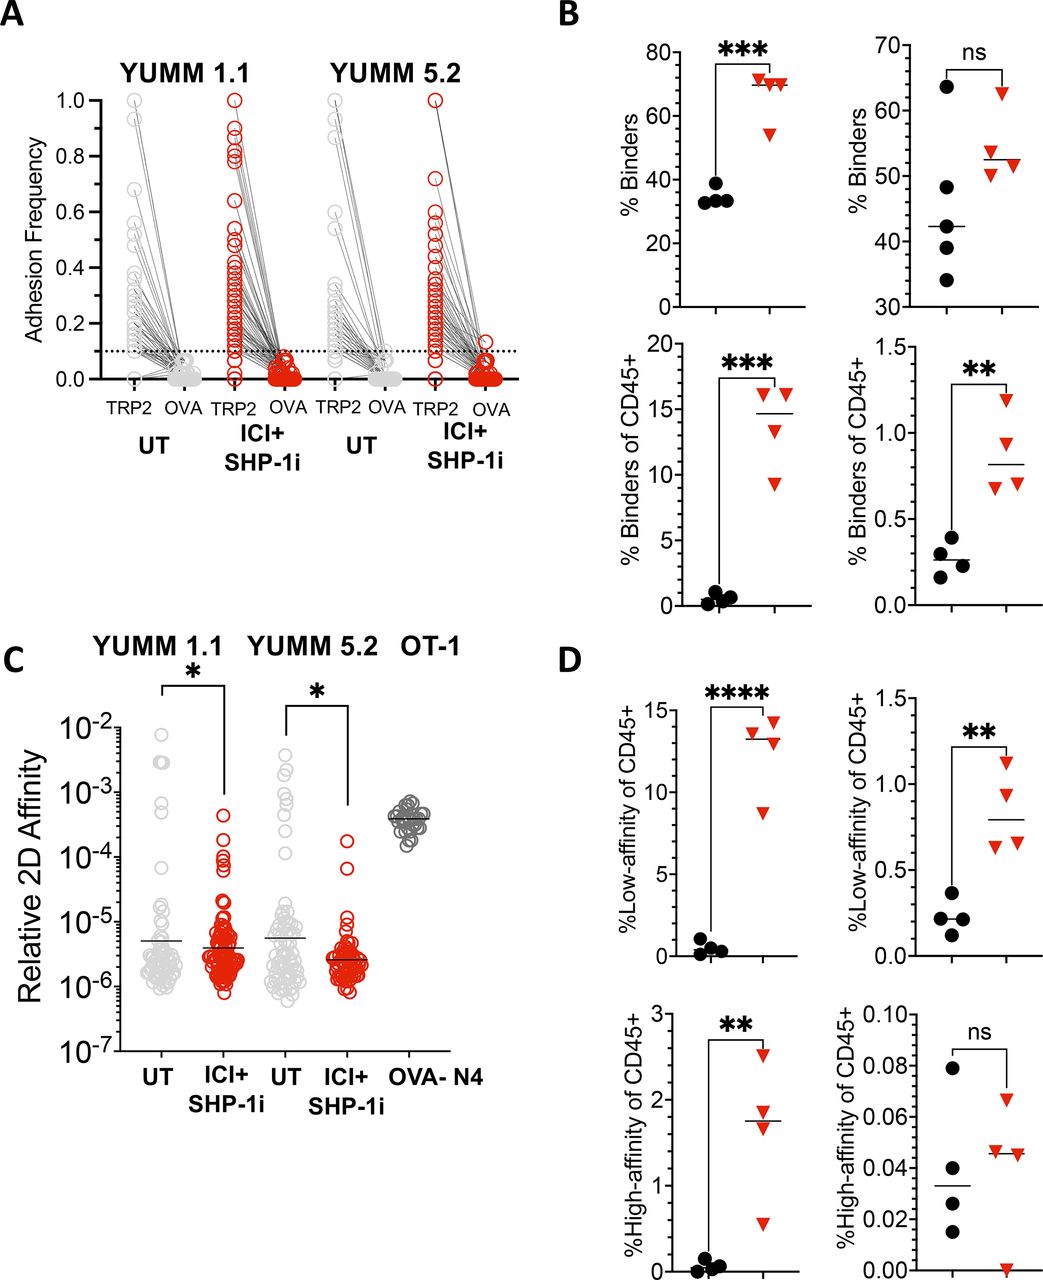
Because our previous work showed that ICI+Shp-1 knockdown enables OT-1 T cells to form an effective antitumor response to B16 tumors expressing low-affinity APLs of OVA257–264,5 we hypothesized that small molecule inhibition of Shp-1 could promote a similar enhancement of endogenous lowaffinity T cells responding to tumor self-antigens in YUMM tumors. Because many antigen-specific T cells fail to bind tetramers,33 we employed a micropipette-based two-dimensional assay to measure the impact of Shp-1 inhibition on low-affinity T cells specific for TRP-2. In this assay, a T cell isolated from the tumor is placed on one micropipette, while an RBC coated with Kb/TRP-2180–188 monomers is placed on the tip of a second micropipette. The two cells are mechanically brought together and separated to detect adhesion. Repeated interactions yield the frequency of T cells able to bind the antigen and the adhesion frequency of each individual T cell, which is then used to calculate relative two-dimensional affinity. The micropipette assay is highly sensitive, allowing observation of relative two-dimensional affinity (AcKa) of TCR:pMHC interactions as low as 10−7 uM.6 Analysis of individual T cells revealed increased adhesion frequencies for the Kb/TRP-2180–188 antigen in all mice tested, regardless of tumor type or treatment status, as compared with a Kb/OVA257–264 control (figure 7A). 30–70% of the CD8 TIL were specific to TRP-2180–188, and CD8 T cells in ICI+Shp-1i YUMM 1.1 tumors showed a significantly increased percentage of binders above those in untreated tumors (figure 7B). While YUMM 5.2 tumors did not show a similar increase in frequency within the CD8 compartment (figure 7B), the overall frequency of TRP-2 binders was increased due to the influx of CD8 T cells into the tumor (figure 7B). Relative two-dimensional affinity was calculated for each mouse receiving either no treatment or ICI+Shp-1i. Although some high-affinity clones were observed (less than 10−5) (figure 7C), we observed a significant decrease in overall affinity following ICI+Shp-1i treatment for both YUMM 1.1 and YUMM 5.2 tumors (figure 7C). For comparison, high-affinity naïve OT-1 T cells binding to OVA257–264 are displayed (figure 7C). Additionally, the frequency of low-affinity T cells (less than 10−5) was significantly increased after combined treatment (figure 7D). Overall, these results indicate that ICI+Shp-1i treatments enhance intratumoral T cell responses in YUMM tumors primarily through increased responses by low-affinity T cells.

ICI+Shp-1i induces increased low-affinity CD8 TIL specific for TRP-2180 –188 . CD8 TILs were isolated from YUMM 1.1 or YUMM 5.2 tumors in untreated or ICI+Shp-1i treated mice on day 21 of tumor growth. The frequency and affinity of TRP-2180–188-specific T cells was assessed by a micropipette-based two-dimensional affinity assay. (A) Plot shows the adhesion frequency of individual T cells specific for Kb/TRP2180–188, as compared with a negative control (Kb/OVA 257–264 ), in untreated and ICI+Shp-1i-treated YUMM 1.1 and YUMM 5.2 tumors. (B) Plots show the frequency of T cells binding to Kb/TRP-2180–188 as a percentage of CD8 T cells or total live CD45+cells in the tumor. (C) Plot indicates the relative two-dimensional affinity of TRP-2-specific T cells isolated from YUMM 1.1 or YUMM 5.2 tumors under the indicated treatment conditions. Each circle represents an individual T cell, and results are pooled from four mice per group. The two-dimensional affinity of a known high-affinity TCR transgenic T cell line, OT-1 T cells specific for Kb/OVA257–264, is shown for reference. (D) Plots show the frequency of low-affinity (<1×10 −5 A c K a mM6) and high-affinity (>1×10⁻⁵ AcKamM6) TRP-2-specific T cells in YUMM 1.1 and YUMM 5.2 tumors under the indicated treatment conditions. Statistical analysis was performed using one-way ANOVA (*p<0.05, ***p<0.01, ***p<0.001, ****p<0.0001). ANOVA, analysis of variance; ICI, immune checkpoint inhibitor; ns, not significant; OVA, Ovalbumin; Shp-1, Src homology region 2 domain-containing phosphatase-1; TCR, T cell receptor; TIL, tumor-infiltrating lymphocyte; TRP-2, tyrosinase-related protein 2; UT, untreated; YUMM, Yale University Mouse Melanoma.
Discussion
We report that targeting inhibitory intracellular TCR signal regulating phosphatase Shp-1 enhances ICI to enhance control of established tumors for which ICI alone is generally ineffective. The observed therapeutic benefit coincides with increased numbers of T cells with low-affinity TCRs specific to a tumor self-antigen, TRP-2. Treatment-induced low-affinity T cells acquire robust effector functions and exert antitumor activity even in the relative absence of high-affinity T cells in the TME. The inclusion of both YUMM models in this study demonstrates the efficacy of Shp-1i+ICI even when immune environments in the tumor lines are disparate. For that reason, we have chosen to focus on phenotypes and therapeutic responses seen in both tumor models.
Low-affinity T cells are robust participants in the immune response in various settings. A majority of low-affinity T cells do not have the avidity required to bind MHC tetramers yet expand and differentiate into effector T cells.10 22 Thus, affinity measurement alone is insufficient for predicting antitumor response and effector function of CD8 T cells. Understanding the mechanisms regulating the ability of widely abundant self-reactive T cells to respond to immunotherapy may ultimately lead to new strategies for controlling tumor growth where high-affinity T cell responses are weak or absent.
Targeting Shp-1 with an inhibitor has potential effects on both conventional T cells and Tregs,17 and recent work has demonstrated that Treg-specific deletion of Shp-1 impaired their ability to control inflammation in vivo.27 Therefore, the role of Shp-1 in Tregs may be complex and context-dependent. While we did not observe broad differences in Treg numbers and FoxP3 expression following Shp-1 inhibition alone, the role of Shp-1 in intratumoral Tregs requires further study. Loss of Shp-1 activity in conventional T cells renders them resistant to Treg-mediated suppression.34 In MC38 tumor-associated macrophages (TAM), the deletion of Shp-1 promotes antitumor function, although we observed no consistent phenotypic change in TAMs across the YUMM tumor models in response to ICI+Shp-1i treatment.35 Previous work showed that combined inhibition of Shp-1 and Shp-2 drove the differentiation of M-MDSC to M1 macrophages.36 While PMN-MDSC frequencies were significantly reduced following treatment in YUMM 1.1, we did not observe a similar reduction in YUMM 5.2 tumors, nor did we observe a consistent change in M1 frequency. Our previously published work found that knockdown of Shp-1 in low-affinity tumor-specific CD8 T cells increased their antitumor activity, indicating an important T cell-intrinsic role in conventional low-affinity CD8 T cells.5 In this study, we observed a significant increase in the CD8: Treg ratio following ICI+Shp-1i, suggesting that treatment drives a shift from an environment dominated by Treg-mediated suppression to an environment dominated by effector CD8 T cell expansion. Our findings best support a model in which Shp-1 intrinsically regulates the effector differentiation of low-affinity T cells.
The kinetics with which TCRs engage peptide antigens presented by MHC (pMHC) influences the strength of the TCR signal.37 However, affinity and TCR signal strength can be uncoupled, and other components of TCR binding kinetics to MHC-bound tumor regulate function.33 It is now clear that the TCR is a mechanosensor whose binding kinetics are influenced by the application of force to the TCR:pMHC bond.38 For example, the application of force to the TCR:pMHC interaction allows for the measurement of bond lifetime under force and reveals the formation of short-lived slip bonds and long-lived catch bonds.38–40 Additionally, the formation of TCR:pMHC catch bonds with long bond lifetimes corresponds directly to TCR signal strength.38 Under pull forces, TCRs form dynamic catch bonds that promote long bond lifetimes with pMHC and enhanced downstream signal strength.37 38 It is likely that, at least in some cases, low-affinity TCRs can engage in stable and long-lived binding with pMHC, induce strong TCR signals, and promote robust effector functions. This conclusion is supported by our finding that inhibition of Shp-1 enhanced both the number and function of low-affinity antitumor T cells, but only when combined with approaches to target the PD-1 and CTLA-4 checkpoints. We propose the hypothesis that Shp-1 is a key intrinsic regulator of low-affinity T cell activation, and given the abundance of low-affinity T cells specific for tumor self-antigens in the tumor immune environment in a variety of cancers, a better understanding of how they are induced and their response regulated could have important therapeutic implications.
It is of interest to note that while some TRP-2-specific T cells expressed PD-1 in untreated mice, many failed to express either PD-1 or T-bet. While it can’t be ruled out that TRP-2-specific responses were in a state of dysfunction or exhaustion, an additional possibility is that some TRP-2-specific T cells within the tumor failed to receive the antigen-dependent activation signals required for them to undergo full effector differentiation. Prior work has indicated that in the setting of melanoma, TCF-1-expressing tumor-specific T cells maintain stem-like characteristics and are required for a productive antitumor response to ICI.41 42 However, the relationship between TCR affinity and the emergence of TCF-1-expressing cells is not well understood. Here, we provide evidence that ICI+Shp-1i can enhance the low-affinity CD8 T cell response, and thus ICI+Shp-1i could induce effector differentiation of low-affinity stem-like T cells. Increased activation of low-affinity CD8 T cells responding to tumor self-antigens may be accompanied by an increased risk of immune-related adverse events. While we did not observe obvious adverse events in our animal model (such as unexpected death or weight loss), given the short period of time of Shp-1i treatment in our model, we cannot rule out the possibility of long-term adverse events related to Shp-1i treatment. A more thorough study of adverse effects mediated by high and lowaffinity T cells after Shp-1i should be done in settings of autoimmune susceptibility.
The potential for some inhibition of Shp-2 is a key caveat to this study. While Shp-2 is activated in T cells downstream of PD-1, Shp-2 inhibitors combine with PD-1 blockade to enhance control of MC38 and CT26 tumors and promote T cell activation, suggesting at least some PD-1-independent activation of Shp-2 in T cells.43 Shp-2 inhibitors are in clinical development, although the success of these approaches is still being assessed.44 Two main pieces of evidence favor the impact of the inhibitor in specifically targeting Shp-1. First, in our previous study, we used shRNA approaches to directly knock down Shp-1 in OT-1 T cells. This led to a lowering of T cell activation threshold, as evidenced by increased phosphorylation of Zap-70. The addition of the Shp-1 inhibitor has a similar impact in this study. Second, in our previous study, Shp-1 knockdown OT-1 T cells exhibited increased antitumor responses to low-affinity antigens after ICI. Similarly, we report here that temporal treatment of established tumors with Shp-1i+ICI induced enhanced antitumor immunity by low-affinity T cells, in line with the role of Shp-1 as a regulator of TCR activation threshold. Shp-1 regulates the most upstream kinases in TCR signaling, including Lck, Zap-70, and the z chain, while other tyrosine phosphatase family members, including Shp-2, likely influence downstream elements of TCR signaling.18 Future studies will be needed to assess the relative contributions of Shp-1 and Shp-2, as well as the potential of targeting these molecules in combination. Shp-1 also associates with PD-1 in vitro,45 but more recent evidence suggests that PD-1 and Shp-1 do not colocalize in vivo.21 Importantly, because Shp-1 is expressed by all hematopoietic cells, a caveat to our inhibitor studies is that other immune cells may be impacted. While we did not see consistent alterations to most other cell types in the tumor environment in response to Shp-1 inhibition, future studies should include a careful examination of their requirement for the observed antitumor benefit.
Data availability statement
Data are available upon reasonable request. All data relevant to the study are included in the article or uploaded as supplementary information.
Ethics statements
Patient consent for publication
Ethics approval
Not applicable.
Acknowledgments
This work was supported by the University of Utah Health Sciences and Flow Cytometry Core Facility. Tetramers and monomers were provided by the NIH Tetramer Core Facility (Atlanta, Georgia, USA).
References
Footnotes
Contributors Conceptualization: JGM and MAW. Methodology: JGM, MAW, BDE and JPS. Investigation: JGM, JPS, KRC, AGR, EMK, JNK, KAF, BR, ABM, AJS, NAC and YK. Validation: JGM. Formal Analysis: JGM, JPS. Writing—original draft: JGM. Writing—revisions and editing: MAW. Resources: MAW and BDE. Funding acquisition: MAW. Supervision: MAW. MAW is the guarantor of the study.
Funding This work was supported by grants from the Department of Defense Congressionally Directed Medical Research Programs (W81XWH2210776, to MAW) and the National Institutes of Health (R01AI172253, to BDE and MAW).
Competing interests None declared.
Provenance and peer review Not commissioned; externally peer reviewed.
Supplemental material This content has been supplied by the author(s). It has not been vetted by BMJ Publishing Group Limited (BMJ) and may not have been peer-reviewed. Any opinions or recommendations discussed are solely those of the author(s) and are not endorsed by BMJ. BMJ disclaims all liability and responsibility arising from any reliance placed on the content. Where the content includes any translated material, BMJ does not warrant the accuracy and reliability of the translations (including but not limited to local regulations, clinical guidelines, terminology, drug names and drug dosages), and is not responsible for any error and/or omissions arising from translation and adaptation or otherwise.