Article Text

Abstract
Background Allogeneic double-negative T-cell (DNT) therapy has emerged as a novel, off-the-shelf cellular treatment with clinical feasibility, safety, and promising efficacy against leukemia. However, the biology of DNTs is less well characterized, and how DNT therapy distinguishes from conventional γδ T-cell therapy remains unclear. Collectively, this hinders our ability to bolster DNT functionalities in cancer therapy. Here, we performed single-cell RNA sequencing with in vitro and in vivo functional analysis on DNTs. As a significant proportion of DNTs express Vγ9Vδ2 (Vδ2) TCR chain, we compared DNTs with donor-matched conventional Vδ2 T cells expanded with zoledronic acid.
Methods Healthy donor-derived allogeneic DNTs and Vδ2 T cells were expanded ex vivo. Single-cell RNA sequencing analysis was performed on both cellular products to identify the transcriptional landscape and inferred cellular interactions within DNTs, followed by comparisons with donor-matched Vδ2 T cells. Unique cellular subsets found only in DNTs were depleted to identify their contributions to the overall efficacy of DNTs against acute myeloid leukemia. The anti-leukemic activity and in vivo persistence of DNTs and Vδ2 T-cells were explored using flow cytometry-based cytotoxicity assays, memory phenotyping, and xenograft models.
Results Despite a shared Vδ2 expression between cellular products, we identified unique cellular compositions in DNTs that contribute to distinct transcriptional and cellular communication patterns relative to the donor-matched Vδ2 T cells, including higher expression of genes identified in chimeric antigen receptor T cells that persist in patients with durable cancer-remission. Vδ2– DNTs exhibited strong persistence characteristics, and their presence promoted the cytotoxic capabilities of Vδ2+ DNTs in repeated stimulation assays. This unique genetic signature and diverse cellular composition of DNTs resulted in better overall ex vivo expansion, prolonged persistence, and superior anti-leukemic activity compared with Vδ2 T cells in vitro and in vivo.
Conclusions These results highlight the unique transcriptional, cellular, and functional profile of human DNTs and support the continued clinical investigation of allogeneic DNT therapy. The data also provide a reference gene signature that may help improve the efficacy of other types of allogeneic adoptive cellular therapies.
- Adoptive cell therapy - ACT
- T-Lymphocytes
- Leukemia
- Immunotherapy
Data availability statement
Data are available on reasonable request. All data relevant to the study are included in the article or uploaded as supplementary information. The data generated in this study are available within the article and its supplementary material. Single-cell RNA sequencing data are found in online supplemental file 2. All other original data generated in this study are available on request from the corresponding author.
This is an open access article distributed in accordance with the Creative Commons Attribution Non Commercial (CC BY-NC 4.0) license, which permits others to distribute, remix, adapt, build upon this work non-commercially, and license their derivative works on different terms, provided the original work is properly cited, appropriate credit is given, any changes made indicated, and the use is non-commercial. See http://creativecommons.org/licenses/by-nc/4.0/.
Statistics from Altmetric.com
WHAT IS ALREADY KNOWN ON THIS TOPIC
Allogeneic double-negative T-cell (DNT) therapy demonstrates safety and potential efficacy in early-phase clinical trials. However, the biology of human DNTs is not well understood, which hinders its clinical applications.
A significant proportion of DNTs express Vγ9Vδ2 (Vδ2) TCR, and both DNTs and conventional Vδ2 T cells display off-the-shelf therapy characteristics for cancer treatment in separate studies. However, how they differ from each other, as adoptive cellular therapies, has never been investigated previously.
WHAT THIS STUDY ADDS
This is the first study to perform single-cell RNA sequencing on ex vivo expanded human DNTs and describe a unique DNT genetic signature relative to Vδ2 T cells.
Ex vivo expanded DNTs exhibit unique subpopulations that provide mechanisms for greater anti-leukemic function and prolonged persistence compared with zoledronic acid-expanded Vδ2 T cells.
Persisting chimeric antigen receptor (CAR) T cells with a DNT phenotype in patients, who achieved long-term remission, share transcriptional features with ex vivo expanded DNTs.
HOW THIS STUDY MIGHT AFFECT RESEARCH, PRACTICE OR POLICY
This study supports the continued clinical investigation of using allogeneic, unmodified or CAR-transduced DNTs for treating leukemias and provides insights to improve the efficacy of DNTs and other types of adoptive cellular therapies.
Introduction
The successes of adoptive cellular therapy (ACT) have helped propel the field of immunotherapy as the fourth pillar of cancer treatment.1 Current Food and Drug Administration-approved cellular therapies rely on patient-derived autologous T cells for chimeric antigen receptor (CAR) T-cell treatment to avoid graft-versus-host disease (GvHD) and host-versus-graft (HvG) rejection.2 Although impressive clinical outcomes are observed,3 autologous cellular therapies are associated with expensive costs and lengthy manufacturing times, which limit patient accessibility and overall therapeutic effectiveness.4 5 Thus, allogeneic cellular products as off-the-shelf therapies have been explored to reduce costs, democratize ACTs, and shorten treatment delivery time.5
Off-the-shelf allogeneic cellular therapies should ideally satisfy various clinical criteria such as scalability and limited GvHD and HvG rejection.6 To circumvent GvHD and HvG rejection, several studies have developed off-the-shelf allogeneic CAR T-cell therapies by genetic deletion of the T-cell receptor (TCR) alpha constant gene and other surface molecules such as CD52 to allow for alemtuzumab-mediated depletion of host lymphocytes.7 However, extensive gene editing increases cell manufacturing complexity and creates concerns around acquired genetic abnormalities.8 As such, allogeneic cellular candidates that do not require genetic alterations remain an attractive option, such as γδ T cells and natural killer (NK) cells. These innate-like immune cells exhibit strong anti-tumor capabilities, especially against hematological malignancies such as acute myeloid leukemia (AML), without inducing GvHD in allogeneic settings.9 Despite the widely accepted safety profile, clinical trials using γδ T cells and NK cells show inconsistent efficacy among patients with AML and highlight the likely need to increase cellular persistence in vivo for prolonged anti-leukemic effects.9–12
Double-negative T cells (DNTs) have emerged as another promising candidate among off-the-shelf therapies.6 Comprising 1%–3% of peripheral leukocytes, these mature T lymphocytes are CD3+CD4–CD8– and lack invariant NK T-cell and mucosal-associated invariant T-cell markers.6 13 Without genetic modifications, ex vivo DNTs can expand to clinically relevant levels and target primary AML cells in preclinical models without the occurrence of GvHD and HvG rejection.6 13 Furthermore, the feasibility, safety, and potential efficacy of allogeneic DNT therapy were demonstrated in a phase I clinical trial in patients with high-risk AML.14 DNT effector function can also be expanded with CAR transduction15 16; this approach has demonstrated promising anti-tumor activity and safety in a recent phase I clinical trial with allogeneic CD19-directed CAR DNTs for patients with high-grade lymphoma.17 However, long-term tracking of allogeneic DNTs was not performed in the clinical trials. Interestingly, several clinical studies have reported that persisting CAR-expressing T cells in patients with long-term cancer remission are significantly enriched with a DNT phenotype, despite their low frequency in the initial infused treatment product.18–20 This suggests potential intrinsic therapeutic properties unique to DNTs, leading to robust anti-cancer effects and better clinical outcomes. Despite advances in clinical applications of DNTs, their biology is poorly understood.
In this study, we characterized human DNTs through single-cell RNA sequencing (scRNA-seq) and in vitro and in vivo functional studies. Given that a majority of DNTs express Vγ9Vδ2 (Vδ2) TCR, the therapeutic properties of DNTs and conventional Vδ2 T cells expanded using distinct protocols were compared. We discovered a unique transcriptional profile and strong cellular communication networks in DNTs, especially in clusters with Vδ2– cells exclusively found in DNTs. These features corresponded to a greater ex vivo expansion and persistent anti-leukemic response against AML, compared with conventional Vδ2 T cells. These data provide insights into DNT therapy and a gene signature reflecting durable anti-cancer effects that are highly desirable for cellular therapies.
Methods
scRNA-seq analysis
Day 14 DNTs and donor-matched Vδ2 T cells were sent for scRNA-seq in accordance with the standard protocol of the Chromium Single Cell 5’ Kit (v2 chemistry) at the Princess Margaret Genomics Centre. A TCR single-cell library was subsequently prepared from the same cells with the Chromium Single Cell V(D)J Enrichment Kit. The 5’ gene expression and TCR library were pooled for sequencing on Illumina NovaSeq, aiming for an average of 50,000 reads per cell. Raw scRNA-seq data were mapped to reference genome GRCh38 using Cell Ranger (V.6.1.2; 10x Genomics) (online supplemental file 2). To filter low-quality cells, we removed genes that were detected in less than 3 cells and cells that had fewer than 100 genes. Next, Scater and scDblFinder packages were used for filtering and doublet identification, respectively. Seurat objects were normalized using SCTransform with default parameters, followed by principal component analysis. SCTransform-normalized datasets were integrated with Harmony21 (V.1.1.0) to remove batch effects. The number of principal components was set to 30, and clustering and the uniform manifold approximation and projection dimensionality reduction technique were performed.
Supplemental material
12,977 cells were considered for downstream analysis using Seurat (V.5.0.1) with scRepertoire (V.2.1.0) for TCR analysis. Module scores were calculated using the AddModuleScore() function in Seurat and quantitatively presented with violin plots using clusters with scores >0 (T-cell signatures) or top scoring 1–2 clusters (persistent CAR-DNT signatures) due to sparsity. Gene ontology (GO) analysis on enriched genes (avg Log FC>0.5) was performed using over-representation analysis and gene set enrichment analysis functions from the ClusterProfiler package,22 and GO gene sets were provided by MSigDB (https://www.gsea-msigdb.org/gsea/msigdb/). Predicted cellular interactions were modeled using the CellChat package23 with default settings. The number of cellular patterns (4) was determined by a drop in Cophenetic and Silhouette values (online supplemental figure S1).23 Other visualization packages include EnhancedVolcano (V.1.20.0), scCustomize (V.2.1.2), and ComplexHeatmap (V.2.20.0).
Supplemental material
Ex vivo expansion of DNTs and Vδ2 T cells
DNTs were isolated from peripheral blood mononuclear cells (PBMCs) of healthy donors through CD4+ and CD8+ depletion cocktail (StemCell Technologies) followed by density centrifugation (Lymphoprep; StemCell Technologies). Enriched DNTs were expanded ex vivo using anti-CD3 (5 µg/mL plate-bound or 0.1 µg/mL soluble, OKT3; BioLegend), IL-2 (250 IU/mL, Proluekin; Novartis Pharmaceuticals), PI3Kδ-inhibitor idelalisib (1 µM; SelleckChem), and AIM-V media (ThermoFisher), as previously described.6 13 24 Ex vivo expansion of Vδ2 T cells was based on Kondo et al’s protocol.25 Briefly, PBMCs were isolated from healthy donors and cultured in CTS OpTmizer T cell Expansion media (ThermoFisher) with IL-2 (500 IU/mL, Proluekin; Novartis Pharmaceuticals), and zoledronic acid (5 µM; Marcan Pharmaceuticals) on day 0, followed by fresh media and IL-2 every 3–4 days until day 20. Effector cells from days 10–20 of culture were used in the experiments.
Flow cytometry-based in vitro cytotoxic assays
Ex vivo expanded DNTs and Vδ2 T cells were co-cultured with AML cell lines for 2 or 24 hours to measure the cytotoxic activities of effector cells. The effector-to-target (E:T) ratios are indicated in the figure legends. AML viability was determined by Annexin V in CD3−CD33+ gated populations for AML cell lines. Percentage-specific killing was calculated by  ×100%.
Xenograft model
Female NOD.Cg-PrkdcscidIl2rgtm1Wjl/SzJ (NSG) mice, aged 8–12 weeks, (Jackson Laboratories) were used for all xenograft experiments and maintained by UHN animal facility in the same room. 5–10 mice were randomly allocated to each treatment group, and each experiment was performed at least two times. The sample size was decided to determine the reproducibility and statistical significance of the findings. There was no exclusion of experimental mice unless they reached the humane endpoint of 20% loss in original body weight, requiring sacrifice. Data collection was conducted in a blinded manner.
For AML xenograft models, mice were sublethally irradiated (225 cGy) 1 day prior to an intravenous injection of 1–1.5×10⁶ MV4-11 cells. Afterward, 2×10⁷ DNTs or Vδ2 T cells were intravenously injected on days 2, 5, and 8. 104 IU rIL-2 (Proleukin) was given intravenously at the time of DNT or Vδ2 T cell infusion. Mice were euthanized 24–25 days after the last DNT or Vδ2 T cell infusion. 2–5 mice from each group were collected twice a week, to avoid over-bleeding of an individual mouse, until the end of the experiment for persistence tracking purposes. Cells from mice femurs were harvested to assess the bone marrow engraftments of AML cells and were analyzed using flow cytometry.
For in vivo T-cell persistence studies, sublethally irradiated (225 cGy) mice were intravenously injected with 2×10⁷ of DNTs or Vδ2 T cells and 1×10⁶ allogeneic PBMCs. 104 IU rIL-2 was given 1 week after the DNT or Vδ2 T-cell infusion. HLA-A2 expression mismatch between donors was used to distinguish between ex vivo expanded effector cells and allogeneic PBMCs (online supplemental figure S2). Mouse peripheral blood was collected twice a week until the end of the experiment and was analyzed by flow cytometry.
Mixed lymphocyte reaction
The ability of DNTs and Vδ2 T cells to suppress alloreactive CD8+ T cells was assessed using mixed lymphocyte reaction, as previously described.15 Briefly, PBMCs were co-cultured with or without allogeneic DNTs and Vδ2 T cells, in the presence or absence of irradiated (3000 cGy) DNTs as stimulators for 6 days at a ratio of 4:1:4 (allogeneic DNTs/Vδ2 T cells: irradiated DNT targets: PBMCs). CD8+ T cells from the co-cultures were isolated using a CD8+ selection kit (StemCell Technologies) and were used as effector cells against live, allogeneic, DNT targets in an overnight cytotoxicity assay at an E:T ratio of 1:1. After the co-culture, the viability of the target cells was determined by Annexin V staining and flow cytometry.
Statistical analysis
All graphs and statistical analyses were generated using GraphPad Prism V.5 and R. Paired and unpaired Student’s t-test, one-way and two-way ANOVA, Fisher’s exact test, and Wilcoxon signed-rank test were used. Bonferroni correction was used for multiple comparisons. nd=not detected, ns=nonsignificant, *p<0.05, **p<0.01, ***p<0.001, ****p<0.0001 indicate statistical significance between groups. Error bars represent mean±SEM or±SD.
Results
Characterization of human DNTs by scRNA-seq
Despite observing the successful use of allogeneic DNT therapy in preclinical and clinical settings,6 14 15 17 the biology of human DNTs is poorly understood. Therefore, we performed scRNA-seq on ex vivo expanded DNTs from three healthy donors and revealed 14 DNT clusters (figure 1A). ScRNA-seq detected high expression of CD3 (CD3G) with minimal expression of CD4, CD8 (CD8A and CD8B), CD56 (NCAM1), and CD19 (figure 1B). Exploring the γδTCR and αβTCR profile, we detected TRDV1 in three clusters (clusters 0, 4, and 12), TRDV2 in all clusters except cluster 9 (figure 1B), and predominantly αβTCR+ cells with unique, individual αβTCR clonotypes in cluster 9 (figure 1C). TRDV3 was not detected in any cluster (online supplemental figure S3).

Characterization of human DNTs by single-cell RNA sequencing. (A) Integrated UMAP plot of ex vivo expanded DNTs from three different donors. (B) Scaled average expression of CD3G, CD4, NCAM1 (CD56), CD8A, CD8B, CD19, TRDC, TRDV1, and TRDV2 in DNT clusters shown by violin plot. (C) Integrated UMAP plot of αβTCR expression and clonotype frequencies in DNTs. (D–H) Top differential gene markers (log2 FC>2) in DNT cluster 0 (D), cluster 4 (E), cluster 12 (F), cluster 9 (G), and clusters 1/2/3/5/6/7/10 (H). (I) Representative flow plot (left) and average relative abundance of different TCR subsets in ex vivo expanded DNTs (n=22). DNTs, double-negative T-cell; UMAP, uniform manifold approximation and projection.
Given the cellular therapeutic differences between Vδ1+ and Vδ2+ cells and a limited understanding of αβTCR+ DNTs at the genetic level,26 top gene markers (log2 FC>2) for specific DNT clusters were identified, excluding the small NK-cell and B-cell populations (clusters 11 and 13) (figure 1B). Cluster 0, comprised Vδ1+, Vδ2+, and αβTCR+ DNTs, exhibited high expression of genes associated with naïve and memory T-cell (MAL and LEF1)27 28 and immune co-stimulatory (CD79A and CD27)29 30 markers (figure 1D). Cluster 4, which had a small population of TRDV1+ cells, shared similar expression patterns as TRDV2+ clusters 1, 6, and 10 with several cell division genes (CDCA2, CDCA3, CDCA8, and CDC25C), FAM family genes (FAM83D and FAM72B), and kinesin family genes (KIF14, KIF18B, KIF20A, and KIF23) (figure 1E). Cluster 12, predominantly comprised of Vδ1+ cells, expressed various killer cell-like receptors (KLRs; KLRC2, KLRC3, KIR2DL2, and KIR2DL4), chemokine ligands (CCL3, CCL4, and CCL4L2), and exhausted T (TEX) -cell or regulatory T (TReg)-cell markers (ENTPD1 and TIGIT)20 31 32 (figure 1F). Notably, Vδ1 chains of cluster 0, 4, and 12 mainly paired with the Vγ4/5/9, Vγ3/4/5/7, and Vγ2/8 chains, respectively (online supplemental figure S4), in which Vγ4Vδ1 and Vγ2Vδ1 T cells have potential persistent cancer-killing properties in patients.18 33 Cluster 9, the major group of αβTCR+ DNTs, was enriched with a chemokine receptor (CCR6), T-cell co-stimulatory molecule (JAML),34 KLRB1 and metabolic immune checkpoint marker (IL4I1)35 (figure 1G). Other high-expressing molecules but with lesser-known functions related to T cells were detected, such as LST1 (leukocyte specific transcript 1), AQP3 (aquaporin 3), and CCNG2 (cyclin G2) (figure 1G).
Given the wide expression of Vδ2 among DNTs, seven clusters with the highest TRDV2 expression (clusters 1–3, 5–7, 10; online supplemental table S1) were grouped together and compared with all other clusters to identify top differential markers. These clusters collectively expressed TRGV9 (figure 1H), commonly paired with the Vδ2 chains.26 Clusters 2/5/7 exhibited expression of cytotoxic markers (GZMB, GZMH, and GZMK), KLRs (KLRC1, KLRD1, KLRG1, and KLRB1), and the LAG3 exhaustion marker,20 whereas clusters 1, 6, and 10 showed comparatively weaker expression (figure 1H). Cluster 3 had high expression of LAG3 and multiple HLA molecules (HLA-DQA2, HLA-DQA1, and HLA-DRB5) (figure 1H). This suggests functional heterogeneity even among TRDV2high DNTs. Using flow cytometry, these major DNT subsets were consistently observed on average among 22 donors whereby Vδ2+ DNTs had the highest average relative abundance (61.3%), followed by Vδ1+ DNTs (23.4%) and αβTCR+ DNTs (15.3%) (figure 1I).
DNT subsets are associated with unique transcriptional gene sets and patterns that support the overall DNT anti-leukemic function
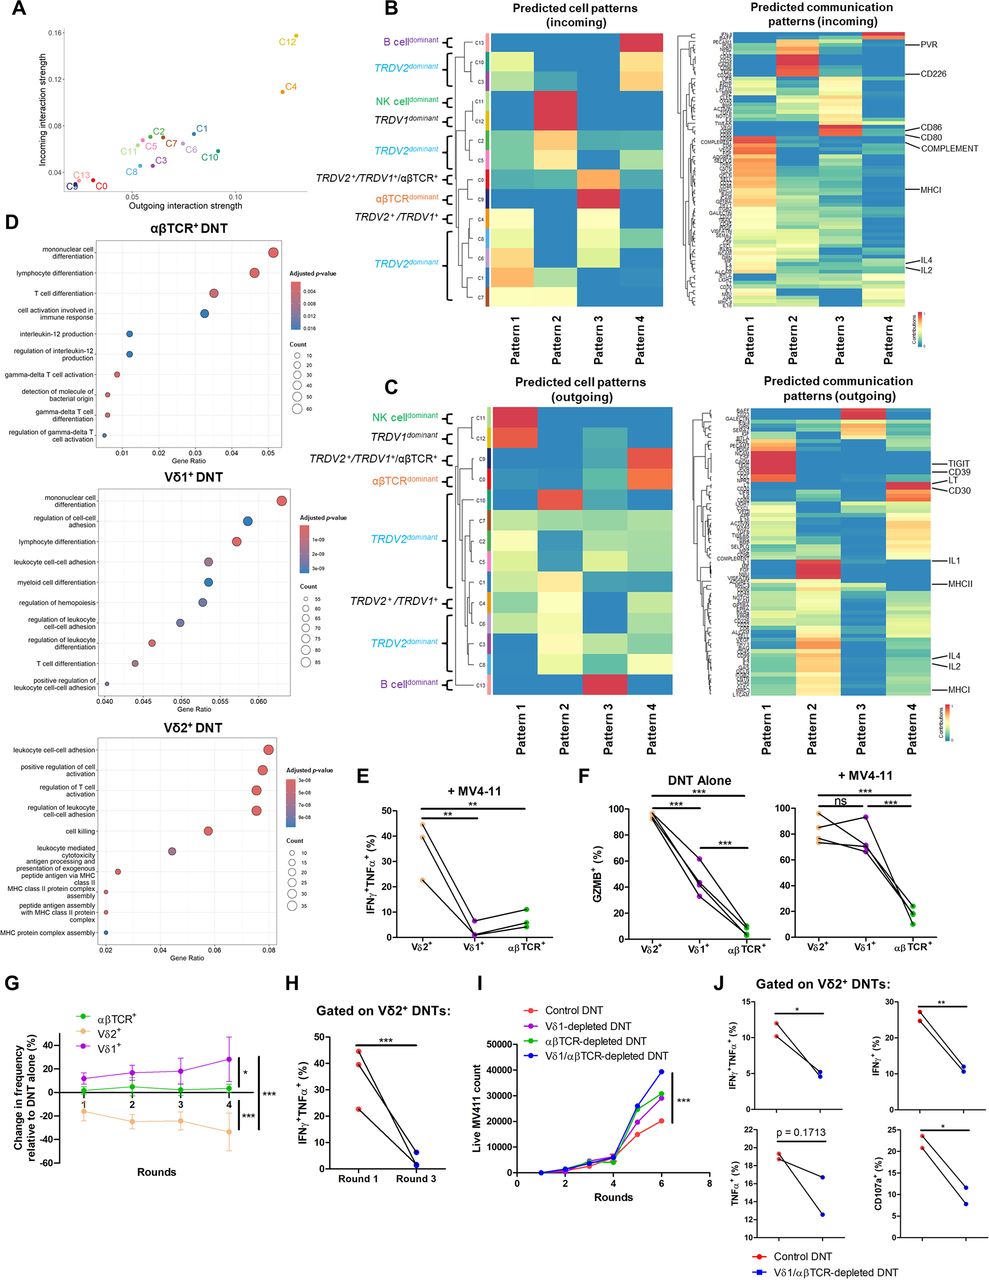
With these distinct transcriptional differences between DNT clusters, we explored the inferred cellular communication patterns between each cluster. A high number and strong levels of interactions were observed between all DNT clusters (online supplemental figure S5), with Vδ1-expressing clusters 4 and 12 displaying the highest predicted incoming and outgoing signals (figure 2A). To investigate potential functional differences between clusters, we first identified incoming (figure 2B) and outgoing (figure 2C) communication patterns. The partial Vδ1+ cluster 0 and αβTCRdominant cluster 9 shared incoming patterns related to T-cell co-stimulation (CD80 and CD86, pattern 3; figure 2B)36 and outgoing patterns associated with NF-κB activators (CD30 and lymphotoxin, pattern 4; figure 2C).37 38 The Vδ1+ cluster 12 and NK-celldominant cluster 11 featured incoming T-cell activation (PVR and CD226, pattern 2; figure 2B)39 and outgoing regulatory (CD39 and TIGIT, pattern 1; figure 2C)20 31 32 patterns. Predominantly Vδ2+ clusters 1/4/6/8 exhibited proinflammatory incoming (COMPLEMENT, MHCI, IL-2, IL-4, pattern 1; figure 2B) and outgoing (MHCI, MHCII, IL-1, IL-2, IL-4, pattern 2; figure 2C) patterns. The B-celldominant cluster 13 featured distinct outgoing signals compared with other clusters (figure 2C), which validated our analysis. Next, we explored differentially expressed markers between Vδ2+ and Vδ2– DNTs and observed that TRDV2+ DNTs were enriched with cytotoxic molecules (GZMB, GZMH, and GNLY) and NK receptors (NKG7 and KLRD1), while TRDV2– DNTs featured naïve and memory T-cell markers (MAL and LEF1)27 28 and co-stimulatory molecule CD2730 (online supplemental figure S6). GO analysis also indicated an enrichment of cytotoxic and T-cell activation pathways in Vδ2+ DNTs, in contrast to cellular differentiation and regulation pathways found among Vδ1+ and αβTCR+ DNTs (figure 2D), suggesting an anti-tumor and help-like function between Vδ2+ and Vδ2– DNT subsets, respectively.

DNT subsets are associated with unique transcriptional gene sets and patterns that support the overall DNT anti-leukemic function. (A) Scatter plot of the inferred interaction strength between clusters in DNTs (n=3). Each dot represents a DNT cluster. (B, C) Predicted incoming (B) and outgoing (C) cellular ligand-receptor patterns among clusters in DNTs. Clusters were grouped into specific communication patterns based on similar inferred ligand-receptor networks. These networks are fully listed on the left of the heatmap, and specific networks are highlighted on the right of the heatmap. (D) Over-representation Gene Ontology analysis of enriched genes among DNTs expressing different TCRs (log2 FC TRDV1>1, log2 FC TRDV2>1, and αβTCR+ cluster 9 with log2 FC>0.05). Top 10 enriched gene pathways are shown. Fisher’s exact test was used for statistics. (E) Ex vivo expanded DNTs (n=3) were co-cultured with or without AML cell lines for 2 hours at an E:T ratio of 1:1 and stained for intracellular TNFα and IFNγ. A representative flow plot and summarized bar graph of TNFα+IFNγ+ cells by each subset of DNTs are shown. Paired dots indicate subsets from the same donor. One-way ANOVA was used for statistics. (F) DNTs (n=4) were co-incubated with or without MV4-11 for 4 hours at an E:T ratio of 1:1 and stained for granzyme B. Paired dots indicate subsets from the same donor. One-way ANOVA was used for statistics. (G) DNTs were cultured alone or with MV4-11 at an E:T ratio of 1:1 for up to 4 days (rounds). Fresh MV4-11 was added every 24 hours (rounds) at the original ratio. The change in subset frequency relative to the DNT alone group was assessed. Data shown are pooled results from two biological replicates. Mean+SD is displayed. Two-way ANOVA was used for statistics. (H) DNTs (n=3) were stimulated for 2 hours (round 1) or 3 days (round 3) with MV4-11 at an E:T ratio of 1:1 and stained for intracellular TNFα and IFNγ. Fresh MV4-11 was added every 24 hours (rounds) at the original ratio. Paired dots indicate subsets from the same donor. Paired Student’s t-test was used for statistics. (I, J) DNTs were depleted of Vδ1+ cells, αβTCR+ cells, Vδ1+ and αβTCR+ cells, or mock sorted as a control. The depleted or control groups were co-cultured with MV4-11 at an E:T ratio of 1:1. Fresh MV4-11 was added every 24 hours (rounds) at the original ratio. The number of live MV4-11, representative of three independent experiments each performed with triplicates, is displayed (I). Intracellular TNFα, IFNγ, and CD107a in Vδ2+ DNTs were measured on round 3 stimulation for Vδ1/αβTCR-depleted DNTs and control DNTs (J). Paired dots indicate subsets from the same donor. Two-way ANOVA and paired Student’s t-test were used for statistics. *p<0.05, **p<0.01, ***p<0.001. ANOVA, analysis of variance; DNT, double-negative T-cell; E:T, effector-to-target.
Vδ2− subsets in DNTs support DNT persistence and Vδ2+ DNT effector function against AML
To functionally validate the contributions of the major DNT subsets in the anti-AML response, we first assessed the expression of inflammatory cytokines (IFNγ and TNFα) and cytotoxic markers (granzyme B, CD107a, and TRAIL) in each DNT subset following co-culture with AML cell lines. Vδ2+ DNTs exhibited significantly higher intracellular IFNγ and TNFα levels compared with Vδ1+ and αβTCR+ DNTs during AML co-incubation (figure 2E and online supplemental figure S7). Vδ2+ DNTs expressed high levels of granzyme B in the presence or absence of AML cells (figure 2F). While Vδ1+ DNTs expressed significantly lower levels of granzyme B in the absence of AML cells, their granzyme B expression level became comparable to Vδ2+ DNTs after co-culture with MV4-11 (figure 2F). In addition, the degranulation marker CD107a was highest in Vδ2+ DNTs, followed by Vδ1+ then αβTCR+ DNTs, after co-culture with AML cells (online supplemental figure S8A). We did not observe significant differences in the expression of another cytotoxic molecule, TRAIL, across different DNT subsets with or without AML cells (online supplemental figure S8B).
Next, we evaluated the role of different DNT subsets on the durability of anti-AML activity mediated by DNTs. During repeated stimulation assays with MV4-11, we observed a decrease in Vδ2+ DNTs frequency and total cell count, whereas the frequency of Vδ1+ DNTs increased and αβTCR+ DNTs remained relatively stable (figure 2G and online supplemental figure S9). Furthermore, we observed a marked reduction in IFNγ and TNFα production by Vδ2+ DNTs between their initial co-culture with AML cells compared with the third round of repeated stimulation (figure 2H). Collectively, these results demonstrate that while Vδ2+ DNTs play a crucial role in mediating immediate anti-leukemic response, their function is relatively short-lived and suggests that Vδ1+ and αβTCR+ DNTs are important for the durable anti-leukemic activity of the DNT product.
The prior cell interaction and GO analysis results suggested Vδ1+ and αβTCR+ DNTs may provide T-cell co-stimulatory and regulatory signals to the primarily cytotoxic Vδ2+ DNTs (figure 2A–D). To functionally evaluate the role of these DNT subsets, we depleted Vδ1+, αβTCR+, or both subsets from DNTs (online supplemental figure S10) and compared their function in a repeated stimulation assay relative to a mock-sorted DNT group as a control. Removing both Vδ1+ and αβTCR+ DNTs most significantly impaired the DNT-mediated anti-AML response (figure 2I). This impairment was partially attributed to reduced DNT proliferation in the Vδ1/αβTCR-depleted group during repeated stimulation, compared with control DNTs (online supplemental figure S11). In the absence of these subsets, Vδ2+ DNTs also displayed a lower frequency of IFNγ+TNFα+ cells and decreased expression of the degranulation marker CD107a by the third round of AML restimulation (figure 2J). Collectively, these findings highlight the transcriptional and functional differences among DNT subsets and their cooperative interactions that contribute to an overall more durable anti-AML response.
DNTs proliferate faster and transcriptionally differ from conventional Vδ2 T cells expanded with zoledronic acid
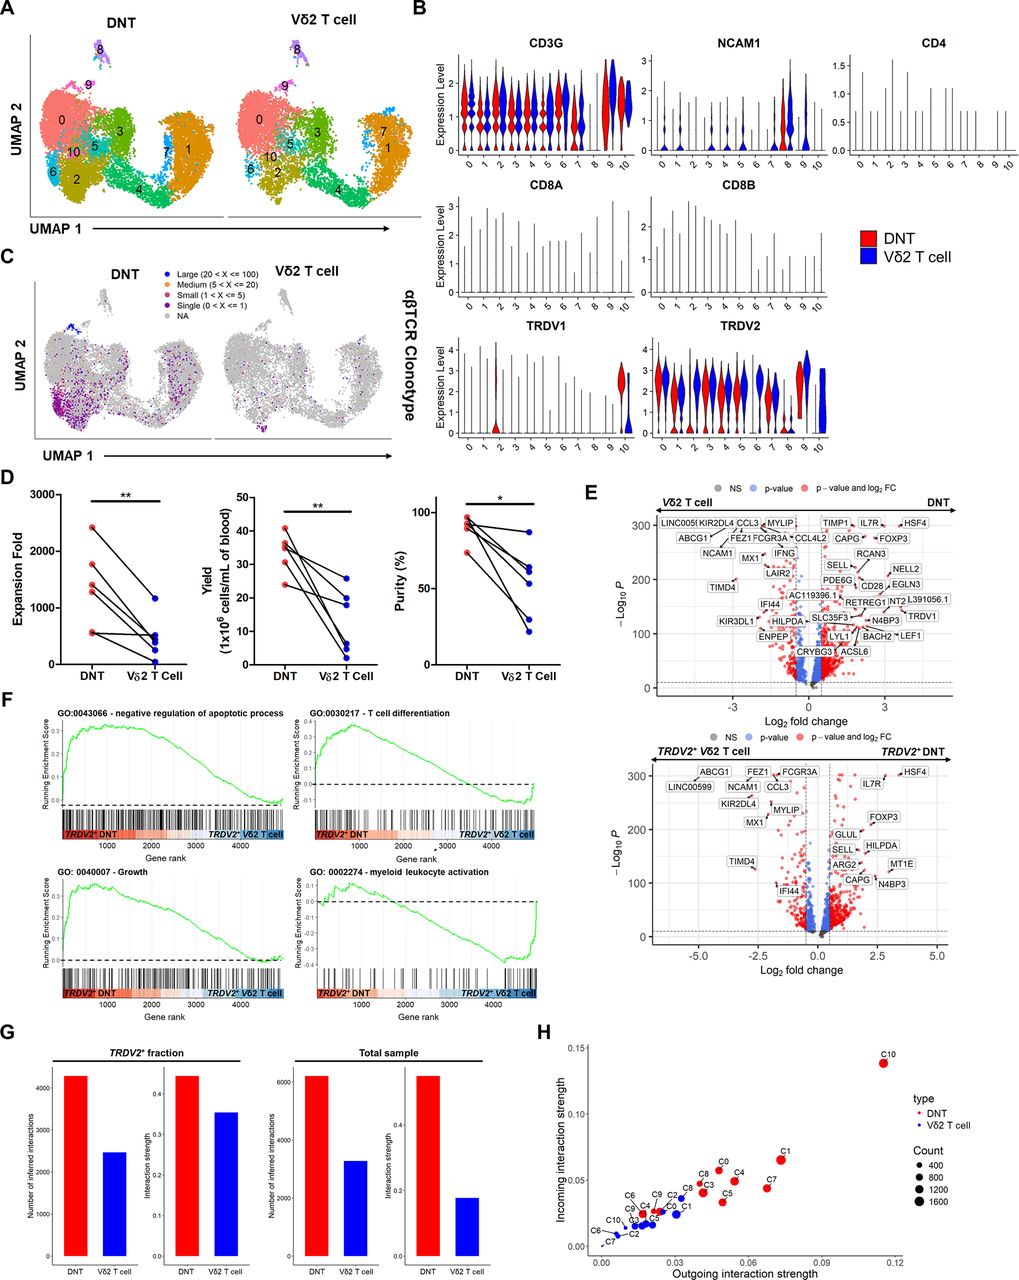
A significant proportion of DNTs express the Vδ2 TCR chain. To better understand the differences between DNTs and conventional γδ T cells, Vδ2 T cells were expanded ex vivo using standardized methods involving zoledronic acid25 in parallel with donor-matched DNTs, and their transcriptional and functional differences were compared. Based on scRNA-seq and flow cytometry analyses, DNTs and Vδ2 T cells shared similar defining surface markers (CD3+CD4−CD8−CD56low/−CD19−Vδ2+), except for prominent Vδ1+ and αβTCR+ populations found in DNTs (figures 3A–C and figure 1I, online supplemental figure S12). Moreover, DNTs had an average 2.8× greater expansion (n=6; figure 3D, left) and average 2.6× greater yield (n=6; figure 3D, middle) than their donor-matched Vδ2 T cells and maintained a higher purity based on respective cellular definitions (DNTs: CD3+CD4−CD8−, Vδ2 T cells: CD3+γδTCR+; figure 3D, right).

DNTs proliferate faster and transcriptionally differ from conventional Vδ2 T cells expanded with zoledronic acid. (A) Integrated UMAP plot of DNTs and donor-matched Vδ2 T cells expanded ex vivo (n=2 for each cell type). (B) Scaled average expression of CD3G, CD4, NCAM1 (CD56), CD8A, CD8B, TRDV1, and TRDV2 in DNT and Vδ2 T-cell clusters shown by violin plot. (C) Integrated UMAP plot showing the αβTCR repertoire profile in DNTs and Vδ2 T cells. (D) Expansion fold (left), yield (middle), and purity (right) of ex vivo expanded DNTs and donor-matched Vδ2 T cells 13 days postexpansion (n=6). Purity of cellular products (CD3+CD4−CD8− for DNTs and CD3+γδTCR+ for Vδ2 T cells) was determined by flow cytometry. Paired dots indicate donor-matched samples. Paired Student’s t-test was used for statistics. (E) Volcano plot of top differential markers between bulk (top) and TRDV2+ (log2 FC>1, bottom) cells in DNTs and Vδ2 T cells. Significance cutoffs denoted by the dotted lines are log2 FC >0.5 and p<10−10. (F) Selected gene set enrichment analysis of differential markers between TRDV2+ (log2 FC >1) cells in DNTs and Vδ2 T cells important for cellular immunity. Statistically significant gene sets (p<0.05) are shown. Fisher’s exact test was used for statistics. (G) Inferred number of interactions and interaction strength between TRDV2+ (log2 FC>1) cells (left) or total cells (right) among DNTs and Vδ2 T cells. (H) Scatterplot comparing the incoming and outgoing interaction strength of inferred ligand-receptor networks between DNT (red) and Vδ2 T-cell (blue) clusters. Size of each dot represents the number of cells, and each dot indicates a cluster. *p<0.05, **p<0.01. DNT, double-negative T-cell; UMAP, uniform manifold approximation and projection.
To examine differences between DNTs and conventional Vδ2 T cells as well as Vδ2+ cells from both cellular products (online supplemental figure S13), top gene markers were identified for bulk and TRDV2+-specific comparisons between DNTs and Vδ2 T cells. DNTs expressed higher levels of TRDV1, as expected, along with the CD28 co-stimulatory molecule (figure 3E, top) relative to Vδ2 T cells. Notably, both comparisons using bulk samples or TRDV2+ DNTs and Vδ2 T cells showed that DNTs exhibited higher levels of genes associated with T-cell memory (Sell and IL7R)20 and HSF4 (heat shock transcription factor 4; figure 3E). Furthermore, higher levels of FOXP3 were detected in the TRDV2+-specific and bulk comparisons (figure 3E), a key transcription factor in TReg cells20 that may provide DNTs with immunosuppressive characteristics. TRDV2+ DNTs were also enriched in gene pathways related to negative apoptosis regulation, growth, T-cell differentiation (figure 3F), and response to hypoxia (online supplemental figure S14). In contrast, Vδ2 T cells, expanded with zoledronic acid, expressed more immune activation receptors (FCGR3A and KIR2DL4; figure 3E), corresponding to enriched expression of myeloid-leukocyte activation genes (figure 3F). Furthermore, DNTs had greater levels of inferred cellular interactions and interaction strength compared with Vδ2 T cells when selecting for only TRDV2+ cells (figure 3G, left) or the bulk sample of both products (figure 3G, right). Overall, higher incoming and outgoing interactions were observed in DNT clusters compared with respective Vδ2 T-cell clusters (figure 3H).
DNTs feature greater co-stimulatory patterns and cytotoxicity against AML relative to Vδ2 T cells
When assessing the inferred interactions between bulk or TRDV2+ DNTs and Vδ2 T cells, we found pathways associated with the regulation of immune activation and cell adhesion that were unique or over-represented in DNTs (figure 4A and online supplemental figure S15). Specifically, we observed elevated signaling networks related to canonical T-cell expansion, effector function (IL-2; figure 4B) and co-stimulation (CD80/86; figure 4C and online supplemental figure S15) in DNTs compared with Vδ2 T cells.36 Interestingly, IL-2 was not a significant communication network in the TRDV2+ comparative analysis while found in the bulk comparison, suggesting that Vδ2− DNTs are providing additional IL-2 signals. Similarly, GO analysis of top markers in DNTs, relative to Vδ2 T cells, revealed an enrichment of proliferative gene sets (figure 4D), in line with expansion data (figure 3D) and the enriched growth genes observed in TRDV2+ DNTs (figure 3F).

DNTs feature greater co-stimulatory patterns and cytotoxicity against AML relative to Vδ2 T cells. (A) Relative information flow plot of inferred cellular networks significantly enriched in DNTs (red) or Vδ2 T cells (blue) (left). Over-representation Gene Ontology analysis of network interactions is significantly enriched in DNTs from CellChat (right). Top gene sets are shown. Fisher’s exact test and Wilcoxon signed-rank test were used for statistics. (B, C) Visualization circle plot of cluster interactions in DNT and Vδ2 T-cell clusters relating to the IL-2 (B) and CD80/CD86 (C) signaling pathway network. Line thickness denotes interaction strength between clusters. (D) Over-representation Gene Ontology analysis of genes enriched in DNTs (log2 FC >1) compared with Vδ2 T cells. Top gene sets are shown. (E, F) DNTs or Vδ2 T cells were co-cultured with AML cell lines, MV4-11 and OCI-AML3, for 2 hours at an E:T ratio of 1:1 (E) and 2:1 (F). Levels of IFNγ and TNFα in the supernatants from AML/T-cell co-culture (top) and T-cell alone (bottom) group were measured by ELISA (E). Percentage-specific killing was measured by Annexin V and flow cytometry (F). Each paired dot represents a donor (n=4 for OCI-AML3, n=6 for MV4-11). Two-way ANOVA (E) and paired Student’s t-test (F) were used for statistics. nd=not detected, *p<0.05, **p<0.01, ***p<0.001. AML, acute myeloid leukemia; ANOVA, analysis of variance; DNTs, double-negative T-cell; E:T, effector-to-target.
The anti-leukemic function of DNTs and Vδ2 T cells has been independently reported but has not been directly compared in parallel.6 40 Although both cellular products express cytotoxic molecules (PRF1, GZMA, GZMB; Online supplemental figure S16), we observed that DNTs secrete 10× and 25× higher levels of IFNγ and TNFα, respectively, when encountering AML targets (figure 4E, top) and lower baseline cytokine secretion when cultured alone (figure 4E, bottom), compared with Vδ2 T cells. Furthermore, DNTs showed significantly greater levels of killing against AML cells relative to donor-matched Vδ2 T cells in vitro (figure 4F). Overall, DNTs demonstrate a better co-stimulatory profile and in vitro cytotoxicity compared with Vδ2 T cells.
DNTs persist longer and demonstrate more durable anti-leukemic function than Vδ2 T cells
One of the factors associated with ACT success is the long-term persistence of T cells.3 To determine the durability of anti-leukemic activity from both products, we first stimulated DNTs and Vδ2 T cells with multiple rounds of AML cells in vitro. DNTs were able to maintain strong anti-leukemic function and control the level of MV4-11 growth significantly better than Vδ2 T cells for at least six rounds of AML stimulation (figure 5A). Similar effects were seen with OCI-AML3 as well (online supplemental figure S17). Next, we investigated whether DNTs could persist longer and provide durable anti-leukemic effects in vivo within AML-engrafted mice. To this end, immune-deficient mice were infused with AML cells followed by injections with an equal number of DNTs or conventional Vδ2 T cells expanded from the same donor. The level of DNTs detected in the blood was 42.5× (14.7×–76.4×) higher than Vδ2 T cells on average, over the course of 14 days after the last T-cell infusion (figure 5B). More importantly, DNT-treated mice had a 64.3% average reduction of AML cells in the bone marrow compared with untreated mice, which was significantly better than the mice treated with Vδ2 T cells (figure 5C). Taken together, these data demonstrated that DNTs persist longer in the recipients and resulted in a more robust anti-AML effect in vivo in comparison to donor-matched Vδ2 T cells expanded with zoledronic acid.

DNTs persist longer and demonstrate more durable anti-leukemic function than Vδ2 T cells. (A) Effector cells, DNTs and Vδ2 T cells, were co-cultured with MV4-11 at an E:T ratio of 2:1. Every 24 hours following co-culture, live target counts were measured, and fresh target cells were added to the co-culture at the original E:T ratio. Data are representative of two independent experiments performed in triplicates. Two-way ANOVA was used for statistics. (B, C) Sublethally irradiated (225 cGy) NSG mice were infused with MV4-11 cells followed by three injections of effector cells. Mice peripheral blood was collected twice a week, and the number of DNTs (red, n=14) and Vδ2 T cells (blue, n=14) was measured by flow cytometry (B). AML bone marrow engraftment levels relative to the untreated group (gray, n=11) were measured by flow cytometry from two pooled experiments. Each dot represents an individual mouse, and error bars indicate mean±SD (C). Two (B) and one (C) way ANOVA were used for statistics. *p<0.05, **p<0.01, ***p<0.001. AML, acute myeloid leukemia; ANOVA, analysis of variance; E:T, effector-to-target; DNT, double-negative T-cell.
Memory and regulatory qualities in DNTs contribute to longer in vivo persistence
Reduced T-cell exhaustion and increased T-cell memory are well-known characteristics that influence T-cell persistence to maintain durable anti-cancer effects and reduce the incidence of disease relapse.3 24 Using an established TEX-cell signature from Anderson et al,20 we found that DNTs had lower expression of conventional TEX-cell markers (TOX, LAG3, and HAVCR) and overall TEX-cell signature score than Vδ2 T cells (figure 6A). Notably, populations with minimal TEX-cell values were the clusters expressing partial TRDV1 and αβTCRs in DNTs (figure 3A–C; figure 6A, middle). Next, we examined the memory phenotypes of both cellular products. DNTs expressed higher levels of naïve T-cell (TNaïve; figure 6B) and central-memory T (TCM)-cell (figure 6C) signatures,20 compared with donor-matched Vδ2 T cells, with strong signals detected in partial TRDV1+ and αβTCR+ populations. These observations were confirmed with flow cytometry, detecting significantly higher frequencies of CD62L+CD45RA– TCM-cell and CD62L+CD45RA+ TNaïve/Stem Cell Memory (SCM)-cell phenotypes in DNTs compared with donor-matched Vδ2 T cells (figure 6D). Further analysis between different DNT subsets showed lower levels of TEX-cell signature scores and higher levels of TNaïve/SCM-cell features among Vδ1+and αβTCR+ DNTs (online supplemental figures S18 and S19) and a higher effector-memory phenotype in Vδ2+ DNTs (online supplemental figure S19). This aligns with previous observations in which Vδ1+and αβTCR+ DNTs persisted longer during chronic AML stimulation (figure 2G), while Vδ2+ DNTs demonstrated greater cytotoxic features (figure 2E).

Memory and regulatory qualities in DNTs may contribute to longer in vivo persistence. (A–C) Volcano plot of top differential markers (cutoffs: log2 FC>0.5 and p<10−10) with different gene labels, and UMAP and violin plots of module scores based on exhaustion T (TEX)-cell (A), naïve T (TNaïve)-cell (B), and central memory T (TCM)-cell (C) signatures from Anderson et al20 between DNTs and Vδ2 T cells. Unpaired Student’s t-test was used for statistics. (D) Memory phenotype of DNTs and Vδ2 T cells based on CD62L and CD45RA expression by flow cytometry. Representative flow plots and individual T-cell memory phenotypes (n=6) are shown. Each paired dot represents a donor. Naïve/stem cell memory T (TNaïve/SCM) cell=CD62L+CD45RA+, central memory T (TCM) cell=CD62L+CD45RA−, effector memory T (TEM) cell=CD62L−CD45RA−, effector T (TEffector) cell=CD62L−CD45RA+. Paired Student’s t-test was used for statistics. (E) Volcano plot of top differential markers (cutoffs: log2 FC>0.5 and p<10−10), and UMAP and violin plots of module scores based on regulatory T (Treg) cell signature from Anderson et al20 between DNTs and Vδ2 T cells. Unpaired Student’s t-test was used for statistics. (F) Allogeneic PBMCs were labeled with carboxyfluorescein succinimidyl ester (CFSE) and stimulated with or without anti-CD3/CD28 antibody in the presence or absence of ex vivo expanded DNTs or Vδ2 T cells (n=4) at a ratio of 1:1 or 2:1. Cells were harvested, and the CD4+ and CD8+ Tconv-cell populations of the allogeneic PBMCs were assessed for inhibition of proliferation by CFSE dilution using flow cytometry. The data show the percentage of non-proliferating responder cells remaining after 5 days in culture. Red dotted line displays the average non-proliferating levels of allogeneic Tconv cells alone with (stim) and without (no stim) anti-CD3/CD28 antibody stimulation. Each paired dot represents a donor. Paired Student’s t-test was used for statistics. (G) PBMCs were co-cultured with (stim) or without (non-stim) irradiated allogeneic DNTs as stimulators in the presence or absence of viable DNTs or Vδ2 T cells as suppressors for 6 days. Afterward, allogeneic CD8+ T cells were sorted from the co-culture and cultured with live DNT targets in an overnight assay. Percentage-specific killing of DNTs by allogenic CD8+ T cells under different co-culture conditions is shown. Schematic of the mixed lymphocyte reaction experiment (top) and percentage specific killing by allogenic CD8+ T cells against DNT targets following different co-culture conditions (bottom). Experiments were performed in triplicates, and data are representative of two independent experiments. Mean±SEM is shown. One-way ANOVA was used for statistics. (H) Sublethally irradiated (225 cGy) NSG mice were infused with 2×10⁷ DNTs or Vδ2 T cells expanded from the same donor and 1×10⁶ allogeneic PBMCs. Mice were bled, and circulating DNTs (n=5) or Vδ2 T cells (n=5) were counted throughflow cytometry for up to 42 days. Data shown are representative of two independent experiments. Error bars represent mean±SEM. Two-way ANOVA was used for statistics. ns=nonsignificant, *p<0.05, **p<0.01, ***p<0.001, ****p<0.0001. ANOVA, analysis of variance; DNT, double-negative T-cell; PBMCs, peripheral blood mononuclear cells.
Allogeneic cellular therapies can be susceptible to host alloreactive T cells, limiting their in vivo persistence and overall therapeutic effectiveness.7 Given that DNTs demonstrated prolonged persistence and previously have displayed immune regulatory capabilities,41 42 we examined the regulatory profile of DNTs and Vδ2 T cells to assess their innate ability to avoid HvG rejection by allogeneic T cells. From scRNA-seq analysis, DNTs exhibited greater scores of the TReg-cell signature from Anderson et al (figure 6E), which supports earlier observations of higher FOXP3 expression in DNTs compared with Vδ2 T cells (figure 3E). When co-culturing allogeneic PBMCs with DNTs or Vδ2 T cells, we observed that CD4+ and CD8+ T-cell populations proliferated significantly less in the presence of DNTs relative to Vδ2 T cells (figure 6F). This feature may be primarily attributed to the αβTCR+ DNT subset, as its depletion impairs the ability of DNTs to suppress allogeneic CD8+ T-cell proliferation (online supplemental figure S20).
Next, to determine if DNTs can evade host alloreactivity through their immunosuppressive function, we conducted a mixed lymphocyte reaction. PBMCs were cultured with (stimulated group) or without (non-stimulated group) irradiated, allogeneic DNTs in the absence or presence of live DNTs or Vδ2 T cells as suppressor cells (figure 6G, top). After 6 days of primary stimulation, CD8+ T cells were isolated from the co-cultures and used as effectors against the live allogeneic DNTs from the same donor used in the primary stimulation. CD8+ T cells stimulated with irradiated, allogeneic DNTs in the presence of live DNTs exhibited lower alloreactivity than the Vδ2 T cell co-culture group, suggesting that DNTs can better suppress the onset of alloreactivity of conventional T cells in the host (figure 6G, bottom). To compare the ability of both cellular products to escape alloreactivity in vivo, allogeneic PBMCs were co-infused with DNTs or Vδ2 T cells into immune-deficient mice. DNTs were detected for a significantly longer period with an average of >50 cells/mL of blood up to 42 days, while Vδ2 T cells fell below 50 cells/mL after 22 days (figure 6H). Overall, the combination of lower exhaustion and higher memory marker expression, and a better capacity to limit alloreactivity may contribute to the ability of DNTs to persist longer than Vδ2 T cells.
ScRNA-seq identifies a unique DNT signature that resembles the genes preferentially expressed in clinically persistent CAR DNTs
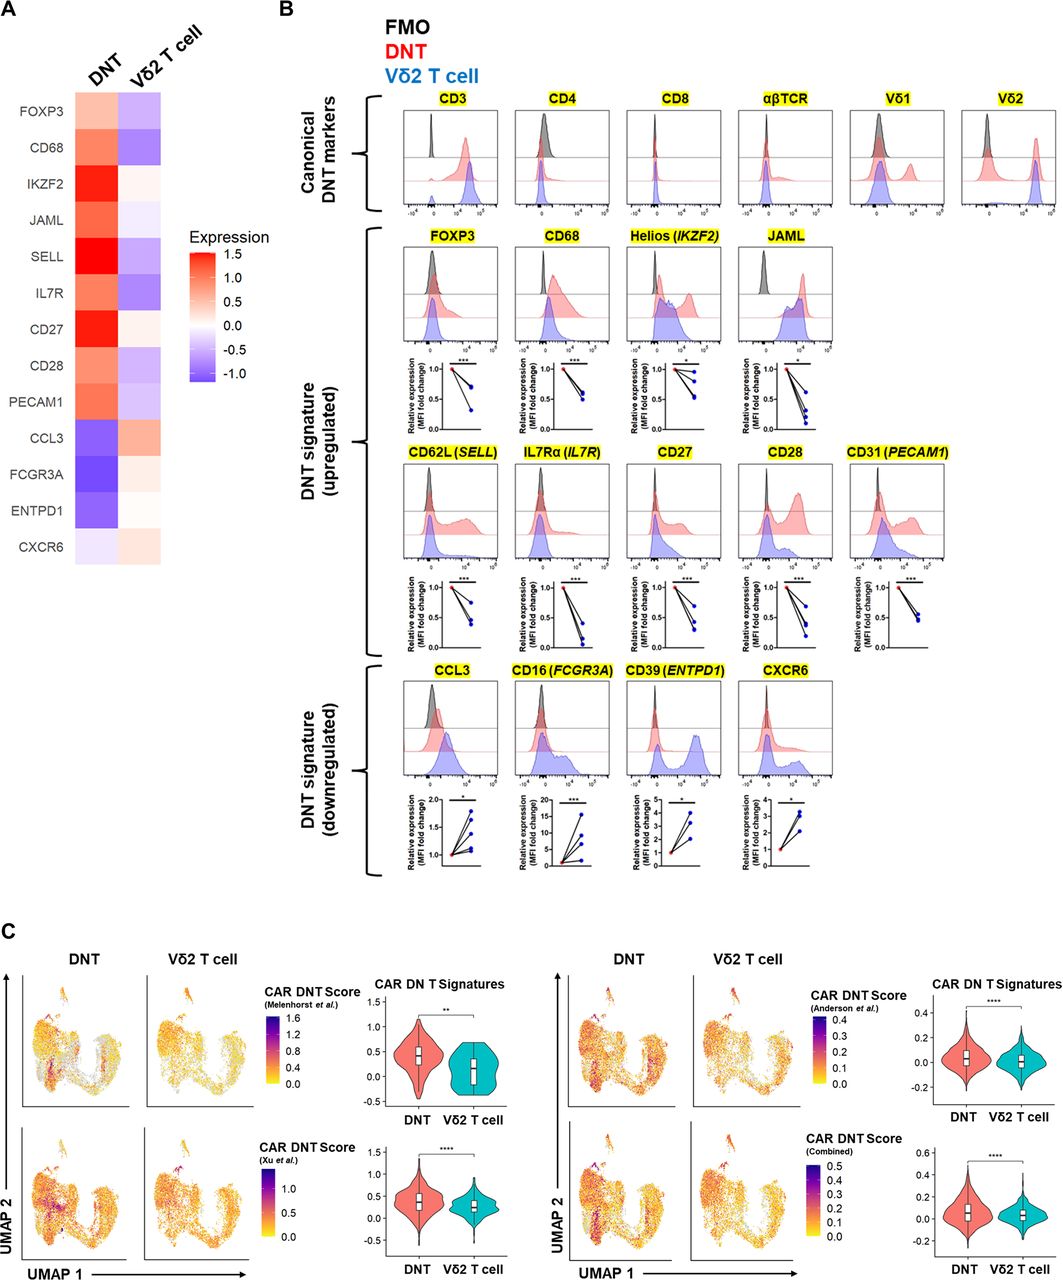
From the scRNA-seq analysis, we identified a unique gene signature in DNTs relative to their Vδ2 T-cell counterparts (figure 7A). Using flow cytometry, we confirmed and validated various extracellular and intracellular molecules to produce a distinct 13-marker DNT signature that highlights the memory function, co-stimulatory nature, and regulatory activity of DNTs, which were differentially expressed relative to Vδ2 T cells (figure 7B).

ScRNA-seq identifies a unique DNT signature that resembles the genes preferentially expressed in clinically persistent CAR DNTs. (A, B) Representative heat map (A) and flow cytometry histograms (B) of DNT signature markers (yellow highlight) between DNTs (red) and donor-matched Vδ2 T cells (blue). Data are representative of at least three donors, and each paired dot indicates a donor. FMO control (black) is shown. Graphs show the mean fluorescence intensity (MFI) of protein expression relative to DNTs. Paired Student’s t-test was used for statistics. (C) UMAP and violin plots of module scores based on persisting CAR T-cell genes from Melenhorst et al18 (TRDC, TRDV1, TRGV4, IKZF2, GZMB, CD244), Xu et al19 (HLA-DRA, HLA-DRB1, CCR7, CD27, CD28, LAMP1), Anderson et al20 (FXYD2, HMOX1, GPR183, TIGIT, HLA-DRA, AC004585.1, TMEM155, FCMR, MTSS1, TTN, DENND2D, NUCB2, EOMES, CAV1, LYAR, ANTXR2, PASK, CEP128, CMTM7, ABHD17B, LIMD2, GNA12), and combined genes. Unpaired Student’s t-test was used for statistics. *p<0.05, **p<0.01, ***p<0.001, ****p<0.0001. DNTs, double-negative T-cell.
Recent longitudinal studies monitored CAR T cells in patients with various cancers, who achieved durable remission for 5–10 years.18–20 CD3+CD4–CD8– DNTs were the dominant population within CAR+ T cells persisting in circulation at time points up to ~5 years despite the initial infusion of conventional CAR T cells, which contained less than 10% CD3+CD4–CD8– cells.18–20 Using proteomic and transcriptomic data collected from these CAR T-cell studies,18–20 we observed that ex vivo expanded DNTs expressed genetic patterns found in these persisting CAR DNTs to a greater degree than Vδ2 T cells (figure 7C). Notably, despite few consistent markers between persisting CAR DNT signatures,18–20 an aggregated persisting CAR DNT signature revealed that the partial Vδ1+ cluster 2 and 10 in DNTs exhibit most of these persistent genes, which were not observed in the corresponding Vδ2 T-cell clusters (figures 3A–C and figure 7C). Further analysis indicated that TRDV1+ DNTs featured the greatest CAR DNT scores when using the Melenhorst et al, Anderson et al, and combined signatures, but TRDV2+ DNTs exhibited the highest CAR DNT score from the Xu et al signature (online supplemental figure S21).18–20 Altogether, these data indicate a unique DNT gene signature that shares transcriptional similarities to persistent CAR DNTs, which have manifested in patients with durable remission status.
Discussion
In this study, we characterized the transcriptional and functional profile of human DNTs. DNTs exhibited three major subsets (Vδ2+, Vδ1+, and αβTCR+), each with individual genetic features and functional properties that work together to elicit a profound anti-AML response.
Vδ2+ T cells and their highly conserved γ9 subset are the predominant γδ T-cell population found in peripheral blood with broad anti-tumor activity and no induction of GvHD in allogeneic settings.26 Although Vδ2 T-cell recovery after allogeneic hematopoietic stem cell transplantation (allo-HSCT) correlates with better patient outcomes,43 clinical trials infusing allogeneic Vδ2 T cells12 or stimulating Vδ2 T cells in vivo with zoledronic acid and IL-211 show variable responses among patients and suggest the need for greater efficacy. Given that over 60% of DNTs express Vγ9Vδ2, we compared the TRDV2+ subset in DNTs with donor-matched Vδ2 T cells expanded with zoledronic acid, the most common method to expand clinical Vγ9Vδ2+ T cells.12 As reported by others, differences in ex vivo expansion methods and co-stimulation can influence T-cell effector function.44 Here, we observed that TRGV9+TRDV2+ DNTs are enriched in cell-killing genes and pathways, similar to Vδ2 T cells. Yet, DNTs displayed greater anti-leukemic activity than Vδ2 T cells both in vitro and in vivo. This may be due to the unique expansion method of DNTs that triggered a cellular response to hypoxia (online supplemental figure S14) and favorable T-cell memory phenotype, increasing cytolysis against cancer and cellular persistence, respectively.24 45 Furthermore, TRDV2+ DNTs potentially received greater levels of co-stimulation from other DNT subsets, not found in the Vδ2 T cells, to strengthen their cytotoxic function, as depleting Vδ2– DNT subsets reduced the overall cytotoxic capacity of Vδ2+ DNTs against chronic exposure to AML. The Vδ2 T cells also appeared to be more overactivated compared with DNTs, leaving them more susceptible to exhaustion and apoptosis,46 based on higher baseline cytokine secretion and lower cytokine release after AML stimulation. Therefore, cellular therapies with pronounced heterogeneous populations such as DNTs may offer stronger anti-tumor capabilities.
Vδ1+ T cells represent a smaller detectable proportion in peripheral blood, compared with their Vδ2+ counterparts, and exhibit flexible Vγ chain pairings. However, they are commonly found in specific tissues such as the skin26 with the potential for stronger anti-cancer function against solid tumors.47 Almeida et al successfully expanded clinical-grade, polyclonal Vδ1 (DOT) cells, as a potential allogeneic cellular therapy against chronic lymphocytic leukemia (CLL) and AML,47 48 which exhibit δ chain pairing with Vγ2/3/4/5/8/9 chains.48 Similarly, our Vδ1+ DNT subsets pair with Vγ2/4/5/8/9 and expressed genes related to co-stimulation and some cytotoxic molecules. These features appear to enhance the primarily cytotoxic Vδ2+ DNT subset and provide greater cellular persistence for the overall DNT product. Interestingly, persisting Vγ4Vδ1+ CAR T cells have been detected in a CLL patient experiencing ~10 years in continuous remission, and tumor-reactive Vγ2Vδ1 were found in a Merkel cell carcinoma patient who achieved a complete response following anti-PD1 therapy.18 33 Although the number of patients in these studies is limited, this suggests anti-tumoral differences between Vδ1+ T cells with varying Vγ chains and warrants further investigation to optimize its cellular therapeutic effects.
Previously, we and others have expanded human αβTCR+ DNTs and characterized their potent immune regulatory activities.41 42 Here, in the presence of other DNT subsets, αβTCR+ DNTs continue to express TReg signature genes and function to suppress the proliferation of allogeneic T cells, along with strong TNaïve and TCM markers and diverse αβTCR repertoire, which allows for response against a broad range of antigens.49 GO analysis revealed that αβTCR+ DNTs are enriched with T-cell differentiation and activation gene sets, suggesting possible potentiation of Vδ2+ and Vδ1+ DNT functions, as their depletion can also influence Vδ2+ DNT effector function. It is important to note that the infusion of TReg-like cells may reduce the efficacy of allo-HSCT by disrupting immune effector function, increasing the probability of relapse.50 However, DNT populations together are shown to exert a better overall anti-AML effect than Vδ2 T cells. The regulatory capacity of αβTCR+ DNTs may contribute to the protection of other DNT subsets from alloreactive T cells and HvG rejection, allowing for overall greater cellular persistence and anti-leukemic activity of cytotoxic DNT populations. The various subsets of DNTs working in concert may be the key factor underlying its robust therapeutic qualities.
Interestingly, three independent, long-term, follow-up studies involving conventional CD4+/CD8+ CAR T-cell therapy observed persistent CAR T cells exhibiting a DNT phenotype in patients with durable cancer remission.18–20 Five of the patients were those who had achieved the longest remission status in their respective ~5 year studies.19 20 Of note, one patient continued to be in remission for ~10 years.18 This phenotypic transition may be due to the downregulation of CD8 and CD4 co-receptors or rapid expansion of a small population of CAR DNTs present in the initial infusion. Signature markers on these clinically persistent CAR DNTs were genetically similar to various populations in the ex vivo expanded DNTs but were absent in Vδ2 T cells. This suggests that the infusion of ex vivo expanded CAR DNTs may yield better clinical outcomes in patients by avoiding the long conversion period of conventional CAR T cells to CAR DNTs.
In summary, our study demonstrated better expansion and a more durable anti-leukemic effect of allogeneic DNTs, relative to donor-matched Vδ2 T cells, and suggested the potential to outperform zoledronic acid-based γδ T-cell therapies. This study also identified a unique transcriptional signature of DNTs that may help identify key pathways to improve the therapeutic efficacy of other types of allogeneic ACTs.
Data availability statement
Data are available on reasonable request. All data relevant to the study are included in the article or uploaded as supplementary information. The data generated in this study are available within the article and its supplementary material. Single-cell RNA sequencing data are found in online supplemental file 2. All other original data generated in this study are available on request from the corresponding author.
Ethics statements
Patient consent for publication
Ethics approval
This study involves human participants and was approved by University Health Network Research Ethics Board (05-0221-T). Participants gave informed consent to participate in the study before taking part.
Acknowledgments
We thank all donors that participated in this study.
References
Footnotes
Contributors ET, IK, JL and LZ conceived and designed the study experiments. ET, IK, KF, JL, MN, JA and YN conducted experiments. ET prepared the manuscript. IK, KF, YN, MN, JA, MDM, SR, JL and LZ provided feedback and edited the manuscript. LZ is the guarantor.
Funding This study was supported by the Princess Margaret Cancer Centre Innovation Acceleration Fund (IAF #2023-003), the Canadian Cancer Society Impact Grant (grant #704121), Canadian Institutes of Health Research (grant #419699, #191854), and Alberta Cancer Foundation Start-Up Fund.
Competing interests MDM is a consultant for Astellas, Abbvie, and Celgene. SR has received research funding from Wugen, USA and MacroGenics, USA and is an inventor of CD3xCD123 bispecific-related patents for the treatment of hematological malignancies. LZ has financial interests (e.g., holdings/shares) in WYZE Biotech Co and previously received research funding and consulting fee/honorarium from the company. LZ and JL are coinventors of several DNT technology related patents and intellectual properties for the treatment of AML. The remaining authors have declared no conflicts of interest.
Provenance and peer review Not commissioned; externally peer reviewed.
Supplemental material This content has been supplied by the author(s). It has not been vetted by BMJ Publishing Group Limited (BMJ) and may not have been peer-reviewed. Any opinions or recommendations discussed are solely those of the author(s) and are not endorsed by BMJ. BMJ disclaims all liability and responsibility arising from any reliance placed on the content. Where the content includes any translated material, BMJ does not warrant the accuracy and reliability of the translations (including but not limited to local regulations, clinical guidelines, terminology, drug names and drug dosages), and is not responsible for any error and/or omissions arising from translation and adaptation or otherwise.