Article Text

Abstract
Background Cancer immunotherapy using immune checkpoint blockade (ICB) has revolutionized cancer treatment. However, patients with multiple myeloma (MM) rarely respond to ICB. Accumulating evidence indicates that the complicated tumor microenvironment (TME) significantly impacts the efficacy of ICB therapy. Therefore, investigating how TME components in MM influence ICB treatment is urgent.
Methods We employed two well-established murine myeloma models, 5TGM1 and Vk*MYC, by intravenously injecting 5TGM1 or Vk*MYC cells into mice, respectively, to determine ICB therapeutic efficacy in MM. Total mouse IgG or Ig2b ELISA or QuickGel split beta SPE kits and in vivo bioluminescent imaging were used to monitor MM tumor burden. Cytometry by time of flight (CyTOF) was used to quantify MM TME components. T cell proliferation and function were detected using flow cytometry. Peptide-Fc fusion proteins were used to deplete myeloid-derived suppressor cells (MDSCs). MMDTR, Foxp3DTR, CD4 KO and CD8 KO mice were used to elucidate the underlying mechanisms. Gene expression levels in human MM were analyzed using Gene Expression Omnibus public datasets.
Results We found that programmed cell death protein 1 (PD-1) antibody treatment had a therapeutic effect in 5TGM1 mice; it was ineffective in Vk*MYC mice. CyTOF indicated that the bone marrow (BM) of both models was inflamed, suggesting that immune suppressive cells might be inhibiting the reactivation of T cells in the BM. We observed higher numbers of MDSCs, regulatory T (Treg) cells, and tumor-associated macrophage (TAMs) in myeloma BM compared with that of tumor-free mice. Specifically, depleting MDSCs, but not Treg cells or TAMs, sensitized Vk*MYC mice and enhanced the response of 5TGM1 mice to PD-1 ICB, which was dependent on CD8+ but not CD4+ T cells. MDSCs, especially M-MDSCs and CD84+ MDSCs, significantly inhibited the activation and cytotoxic cytokine production of CD8+ T cells in vitro. Moreover, database profiling of patient BM revealed a negative correlation between MDSCs signature genes and cytotoxic CD8+ T cell signature genes, with post-maintenance patients with myeloma displaying a higher ratio of cytotoxic CD8+ T cell to MDSCs signature genes compared with pretreated patients.
Conclusion Our study highlights the potential of MDSCs depletion in enhancing the sensitivity of patients with myeloma to PD-1 ICB therapy.
- Hematologic Malignancies
- Immune Checkpoint Inhibitor
- Multiple Myeloma
- Myeloid-derived suppressor cell - MDSC
Data availability statement
All data relevant to the study are included in the article or uploaded as supplementary information.
This is an open access article distributed in accordance with the Creative Commons Attribution Non Commercial (CC BY-NC 4.0) license, which permits others to distribute, remix, adapt, build upon this work non-commercially, and license their derivative works on different terms, provided the original work is properly cited, appropriate credit is given, any changes made indicated, and the use is non-commercial. See http://creativecommons.org/licenses/by-nc/4.0/.
Statistics from Altmetric.com
- Hematologic Malignancies
- Immune Checkpoint Inhibitor
- Multiple Myeloma
- Myeloid-derived suppressor cell - MDSC
WHAT IS ALREADY KNOWN ON THIS TOPIC
Patients with multiple myeloma rarely respond to immune checkpoint blockade (ICB) in clinics.
The efficacy of ICB is hindered by the components in tumor microenvironment (TME), especially immunosuppressive cells.
WHAT THIS STUDY ADDS
Two MM murine models (5TGM1 and Vk*MYC) exhibit different responses to programmed cell death protein 1 (PD-1) ICB treatment.
Myeloid-derived suppressor cells (MDSCs) in TME inhibit the therapeutic effects of PD-1 ICB in murine MM, and depleting MDSCs improves the response of Vk*MYC and 5TGM1 mice to PD-1 ICB therapy which is dependent on CD8+ T cells.
MDSCs, especially CD84+ MDSCs, suppress CD8+ T cell activation in response to PD-1 ICB in murine MM models.
There is a negative correlation between MDSC and cytotoxic CD8+ T cell signature genes in the bone marrow of human patients with MM, and post-maintenance patients with myeloma had a higher ratio of cytotoxic CD8+ T cell to MDSC signature genes than pretreated patients.
HOW THIS STUDY MIGHT AFFECT RESEARCH, PRACTICE OR POLICY
Targeting MDSCs may be a potential strategy to sensitize human MM to ICB treatment.
Introduction
Multiple myeloma (MM) is a hematological malignancy characterized by the accumulation of abnormal plasma cells in the bone marrow (BM).1 2 Despite significant advancements in the treatment of MM, most patients eventually relapse after initial treatment, underscoring an urgent need for novel strategies.3–6 The introduction of immune checkpoint blockade (ICB), such as inhibitors of programmed cell death protein 1 (PD-1), has revolutionized the treatment landscape for various cancers by unleashing the immune system’s power against tumor cells.7–9 However, clinical therapeutic efficacy varies, with low or no response to PD-1 inhibitors observed in patients with MM, for reasons that remain unclear.10 Therefore, investigating potential mechanisms to increase ICB response in patients with MM is clinically significant.
ICB works by blocking the interaction between checkpoint proteins and their receptors, thereby preventing the inactivation of T lymphocytes and promoting the antitumor activity of T lymphocytes.7 8 Accumulating evidence indicates that the efficacy of ICB is hindered by complicated tumor microenvironment (TME), which plays a crucial role in tumor progression, immune evasion, and treatment resistance in MM.9 The intricate interplay among malignant plasma cells, stromal cells, immune cells, and extracellular matrix components shapes the MM TME and creates a dynamic and immunosuppressive niche.11–13 Within this TME, modulating the balance between antitumor immune responses and immune tolerance is essential for tumor suppression.14–16 For example, blockade of interferon α and β (IFNα and IFNβ) receptors inhibited the expansion and immunosuppressive activity of myeloma-associated Treg.15 Inhibiting myeloid-derived suppressor cells (MDSCs) accumulation led to increased T cell activity and reduced MM progression.16 Furthermore, we previously demonstrated that plasmacytoid dendritic cells and tumor-associated macrophage (TAMs) within the TME are crucial for MM development, progression, and chemoresistance.4 17 However, whether the interaction of immune cells within TME would affect the therapeutic efficacy of ICB remains largely unknown.
To date, numerous research endeavors and ongoing clinical trials are dedicated to comprehending the underlying mechanisms of poor responses to ICB and exploring innovative combination strategies aimed at augmenting the therapeutic outcomes for patients with MM.18–20 We hypothesized that the interaction of immune cells in TME plays an important role in regulating the response of ICB therapy in MM. In this study, we used two well-established immunocompetent MM mouse models to elucidate the mechanisms underlying the low PD-1 ICB response in MM. We discovered that the immune cell composition in the TME differs between PD-1 ICB-resistant Vk*MYC-bearing mice and PD-1 ICB-responsive 5TGM1-bearing mice. Furthermore, we showed that MDSCs, rather than Treg cells or TAMs, play a crucial role in PD-1 ICB resistance, and depleting MDSCs significantly enhances the antitumor effects of PD-1 inhibitors in murine MM.
Materials and methods
Cell lines and cell culture
Murine MM 5TGM-luc cell line was a kind gift from Dr. Frederic J Reu and cultured with Iscove's Modified Dulbecco's Medium (IMDM) supplemented with 10% fetal bovine serum (FBS) (Gibco). Vk*MYC cell line Vk12653 was kindly provided by Leif P. Bergsagel (Mayo Clinic in Arizona, Phoenix, Arizona, USA) and maintained in mice as previously reported.17 Splenocytes containing more than 50% of malignant plasma cells were frozen and used for experiments.
Mouse study
C57BL/6J, LysmCre×Csf1rLsL-DTR C57BL/6 mice (MMDTR mice), Foxp3 DTR mice (C57BL/6-Tg (Foxp3-HBEGF/EGFP)23.2Spar/Mmjax), CD4 KO mice (B6.129S2-Cd4tm1Mak/J), and CD8 KO mice (B6.129S2-Cd8atm1Mak/J) were purchased from the Jackson laboratory. C57BL/KalwRij mice were purchased from Envigo (Horst, Netherland).
To generate the MM mouse model, 5TGM1-luc or Vk*MYC cells were intravenously inoculated into 8-week-old female and male C57BL/KalwRij and C57BL/6J mice, respectively. Two weeks later, when the tumor developed, mice were intraperitoneally injected with 100 µg IgG (2A3, BE0089 from BioXCell) or αPD1 (RMP1-14, BE0146 from BioXCell) mAb every 3 days for a total of three injections. For MDSCs depletion, mice were intravenously injected with 50 µg of peptibodies for 3 consecutive days (days 10, 11, and 12), and BMs were collected for depletion efficacy detection. Tumor burdens were evaluated by detecting the level of M-protein/immunoglobulin light chain secreted by MM cells by ELISA or bioluminescence on the in vivo imaging system (IVIS). All mice used in this study were maintained in a temperature-controlled and humidity-controlled environment and given unrestricted access to food and water. Mice were humanely sacrificed when moribund. Survival was evaluated from the day of tumor inoculation until death.
In vivo bioluminescent imaging
In vivo bioluminescent imaging was performed as previously described.4 Briefly, images were acquired at an exposure time of automatic mode after mice were subcutaneously injected with luciferin (Gold Biotechnology) for 10 min by using IVIS100 and IVIS-CT imaging system (PerkinElmer). Luciferase signal intensity was quantified and analyzed using Living Image V.4.0 software.
Serum protein electrophoresis
Mouse serum was obtained by tail vein blood collection and serum gel electrophoresis was performed using the QuickGel Split Beta SPE Kit (Cat. No. 3550, 3550T) from Helena according to the manufacturer’s protocol.
ELISA
To monitor tumor burden of murine MM model (Vk*MYC cells and 5TGM1-luc cells), serum was collected through the tail vein. IgG (IgG Total Mouse Uncoated ELISA Kit, Catalog # 88-50400-88) or IgG2b (IgG2b Mouse Uncoated ELISA Kit, Catalog # 88-50430-88) concentration was measured by ELISA according to the manufacturer’s protocol.
Isolation of BM and spleen cells
BM from sacrificed mice was flushed by PBS from the mouse tibia and femurs using a 28-gage needle and plastic syringe. Flushed BM cells were then centrifuged at 600 g at 4°C for 5 min and suspended in 2 mL of red blood cell lysis buffer for 5 min at room temperature. Cells were quenched with 10 mL of PBS containing 2% FBS (Gibco) and centrifuged at 600 g at 4°C for 5 min. Cells were then resuspended in 3 mL of fluorescence-activated cell sorting (FACS) buffer and counted by automated cell counter Countess II (Thermo Fisher Scientific, AMQAX1000).
The spleen was pushed through a 70 µm cell strainer and washed with Roswell Park Memorial Institute (RPMI) 1650 medium to create splenocytes suspension. Cells were centrifuged at 600 g at 4°C for 5 min and incubated for 5 min in 5 mL of red blood cell lysis at room temperature. Cells were quenched with 10 mL of RPMI with 5% FBS and centrifuged at 600 g at 4°C for 5 min. Cells were then resuspended in 3 mL of FACS buffer, counted by Countess II, and processed for FACS.
Flow cytometry
Flow cytometry was performed as previously described.21 22 Flow cytometry antibodies for human and/or murine APC-CD138, FITC-CD138, BV711-CD11b, PE-CD11b, PerCP/Cy5.5-CD11b, APC-CD45, BUV805-CD45, FITC-I-A/I-E, BUV395-PD-L1, PE-CD11b, AF700 -Ly6G, PE-CD115, PE-CD8, FITC-CD4, PerCP/Cy5.5-Foxp3, APC-LAG3, APC-Cy7-CD3e, APC-TNFa, APC-IFNγ, BV421-Ly6C, BV570-Ly6G, PerCP/Cy5.5-CD11b, CD84-BV421, HLA-DR-APC, CD14-APC, mouse MDSC Flow Cocktail 2, and isotype control were purchased from Biolegend (San Diego, California). For intracellular staining, cells were stimulated with phorbolmyristate acetate and ionomycin and treated with brefeldin A (Biolegend) for 4–5 hours before staining for intracellular cytokines using the BD Fixation/Permeabilization Solution Kit (BD Bioscience). Results were then acquired using BD aka Fortessa X30 systems. Data were analyzed with FlowJo_V10 software (TreeStar).
T cell proliferation and function assay
For T cell proliferation assay, CD8+ T cells were isolated from the spleen by MACS using anti-CD8 microbeads, and labeled with carboxyfluorescein diacetate succinimidyl ester (CFSE, Thermo Fisher Scientific) according to the manufacturer’s instruction. Isolated CD8+ T cells were cocultured with MDSCs at 4:1 ratio on 48-well plates precoated with anti-CD3 (1 µg/mL) and anti-CD28 antibodies (1 µg/mL) for 72 hours. The percentages of proliferating CD8+ T cells were determined by CFSE-dilution. For T cell function assay, CD8+ T cells were isolated from the spleen by MACS using anti-CD8 microbeads and cocultured with MDSCs at 4:1 ratio on 48-well plates precoated with anti-CD3 (1 µg/mL) and anti-CD28 antibodies (1 µg/mL) for 72 hours. The secretion of IFNg and tumor necrosis factor alpha (TNFa) in CD8+ T cells were then detected by flow cytometry intracellular analysis.
Analysis of TME by cytometry by time of flight
Helios cytometry by time of flight (CyTOF) system was used based on the Houston Methodist Research Institute Immunomonitoring Core protocol. Live single-cell suspension from BM was stained with metal-conjugated viability dye and block. Surface markers were stained first before fixation. If there were intracellular markers in the panel, cells were fixed with Foxp3 staining kit and stained with intracellular antibodies. Cells were incubated in metal-conjugated cell ID overnight at 4°C. Samples were filtered through a 40-µm strainer before acquisition.
Analysis of gene expression data of patients with cancer
Publicly available datasets were downloaded from Gene Expression Omnibus. For analysis of the expression of polymorphonuclear (PMN)-MDSCs, M-MDSCs, and cytotoxic CD8+ T cell signature genes, GSE104171 and GSE136324 datasets were used by downloading the Series Matrix files. For generation of gene expression signatures, normalized expression values were log2-transformed and ranked by the mean expression value of signature genes. The following gene signatures were used: PMN-MDSCs (S100A8, TGFB1, ARG1, IL6, IRF1, OLR1), M-MDSCs or CD4+ T cells (S100A8, TGFB1, ARG1, IL6, CD14, VEGFA), and cytotoxic CD8+ T cells (CD8A, TNF, GZMA, GZMB, GZMH, GZMK, GZMM).
Statistical analysis
The statistical analysis and graphs were generated by GraphPad Prism V.8.01 software and all data are shown as mean±SD. One-way analysis of variance test was employed to compare three or more independent groups. Unpaired Student’s t-test was used to compare two independent groups, and the Log-rank (Mantel-Cox) test was used to compare the survival curves between groups. The significance threshold was set at a p value less than 0.05. Linear regression analyses were performed using GraphPad Prism V.8 and slope and R values were calculated automatically in the analysis table.
Results
Vk*MYC and 5TGM1 MM models exhibit different responses to PD-1 ICB
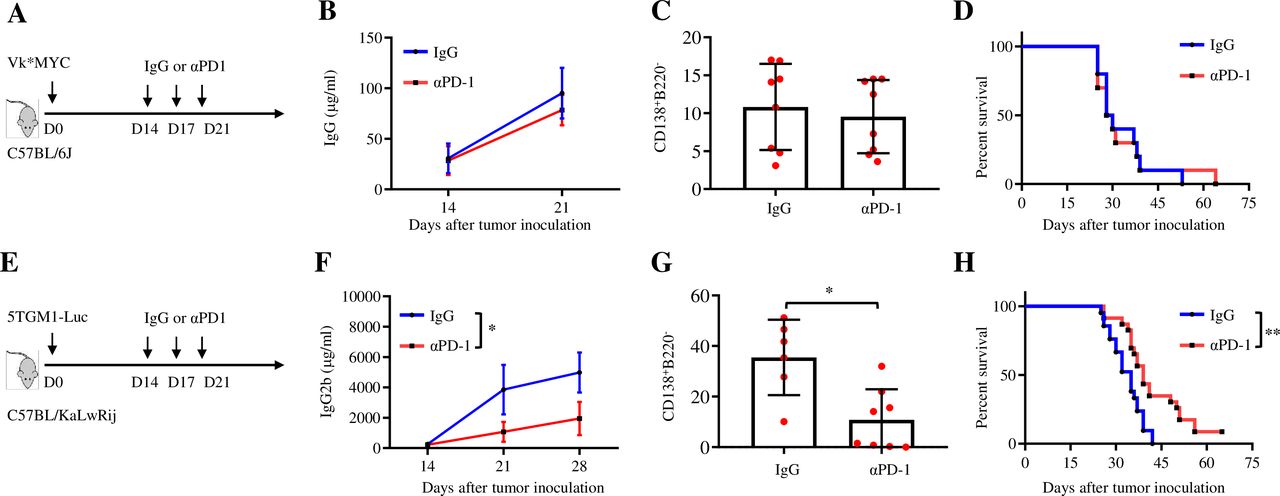
Vk*MYC mice develop MM with age, share many clinical features of human MM23 and are an excellent model for investigating the immune responses in MM.17 20 24 Vk*MYC MM cell lines are available and can establish MM in syngeneic mice.25 5TGM1 cells arose spontaneously from aging C57BL/KaLwRij mice and can establish MM by intravenous injection into syngeneic mice, which is another widely used MM mouse model.26 To simulate clinical response to ICB in MM, we first determined the effects of PD-1 ICB in Vk*MYC- and 5TGM1-bearing mice by using αPD-1 mAb or control IgG to treat the mice (figure 1A,E). In Vk*MYC-bearing mice, αPD-1 treatment showed no effect on reducing tumor burden, detected by measuring the level of circulating M-protein secreted by MM cells and the number of CD138+B220− MM cells in the BM (tumor bed), or the survival of the mice (figure 1B–D and online supplemental figure 1A, B). In contrast, αPD-1 treatment significantly reduced the level of circulating M-protein and the number of BM CD138+B220− MM cells in the BM and prolonged the survival of 5TGM1-bearing mice (figure 1F–H and online supplemental figure 1C). These results demonstrate an interesting phenomenon that Vk*MYC and 5TGM1 MM models display different responses to PD-1 ICB and the Vk*MYC MM model may better recapitulate the situation of human MM in response to ICB treatment.
Supplemental material

Vk*MYC and 5TGM1 MM models exhibit different responses to PD-1 ICB. (A) C57BL/6 mice were inoculated with 0.5×10⁶ Vk*MYC cells intravenously. After 14 days, mice randomly received intraperitoneal injections of 100 µg control IgG or αPD-1 every 3 days, for three total injections. Shown are (B) tumor burden detected by measuring the concentration of IgG secreted by MM cells using ELISA (n=8), (C) percentages of CD138+B220− plasma cells in the BM (n=8), and (D) Kaplan-Meyer survival plots of IgG-treated or αPD-1-treated mice (n=10). The data shown are representative of two independent experiments. (E) C57BL/KaLwRij mice were inoculated intravenously with 2×10⁶ 5TGM1-luc cells and, on day 14, randomly received intraperitoneal injections of 100 µg control IgG or αPD-1 every 3 days for a total of three injections. Shown are (F) tumor burden detected by measuring the concentration of IgG2b secreted by MM cells by ELISA (n=6), (G) percentages of CD138+B220− plasma cells in the BM (n=6), and (H) Kaplan-Meyer survival plots of IgG-treated or αPD-1-treated mice (n=20). Data are presented as mean±SD. *P<0.05; **p<0.01. BM, bone marrow; ICB, immune checkpoint blockade; MM, multiple myeloma; PD-1, programmed cell death protein 1.
The composition of immunosuppressive cells differs between Vk*MYC and 5TGM1 MM models
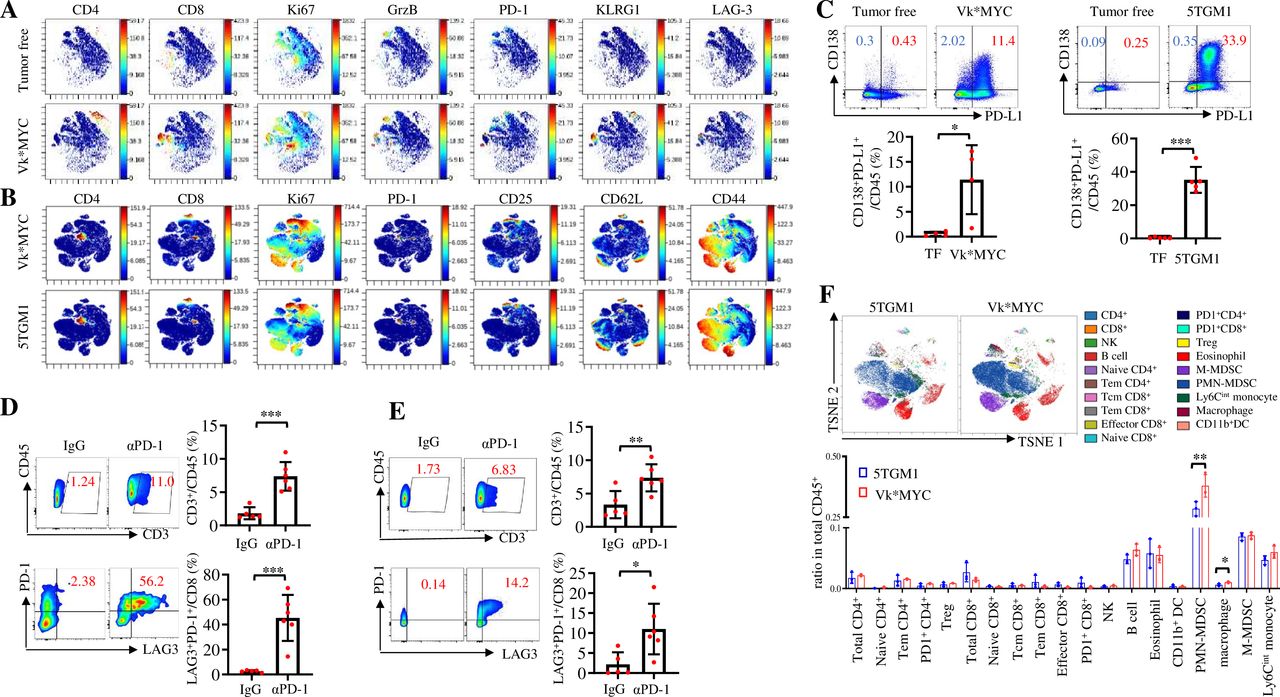
As the two murine MM models responded differently to PD-1 ICB, we attempted to elucidate the underlying mechanisms. PD-1 ICB works by (re)activating T cells to attack tumor cells and their therapeutic effects are largely impacted by the TME.2 27 To characterize TME in murine MM, we collected BM from Vk*MYC- or 5TGM1-bearing and tumor-free mice to perform CyTOF analysis. First, we observed that, compared with tumor-free mice, CD4+ and CD8+ T cells in the BM of Vk*MYC-bearing mice displayed highly proliferative (Ki-67+), cytotoxic (granzyme B+) and exhausted (PD-1+, LAG-3+ and KLRG1+) features (figure 2A). Similarly, both Vk*MYC- and 5TGM1 MM-bearing mouse BM contained highly proliferative (Ki-67+), exhausted (PD-1+) and activated (CD25+, CD62L+, and CD44+) T cells (figure 2B). In addition, CD138+ MM cells in the BM of both Vk*MYC- and 5TGM1-bearing mice expressed high levels of PD-L1 (figure 2C). These findings indicate that, similar to human MM,28 29 murine MM BM is also an inflamed or ‘hot’ TME that has the components for a positive response to ICB treatment.30 31 In line with this notion, αPD-1 treatment significantly increased the infiltration of CD45+ CD3+ T cells and PD-1+ LAG-3+ CD8+ T cells into the BM of 5TGM1-bearing (figure 2D) and Vk*MYC-bearing mice (figure 2E).

The composition of immunosuppressive cells in TME differs between Vk*MYC-bearing and 5TGM1-bearing mice. CyTOF analysis showing the representative t-SNE displays of protein expression in the BM of (A) tumor-free or Vk*MYC-bearing MM mice or (B) Vk*MYC-bearing or 5TGM1-bearing MM mice. (C) PD-L1 expression on CD138+ plasma cells in the BM of tumor-free (TF), Vk*MYC-bearing or 5TGM1-bearing mice (n=4–5). (D) Percentages of CD3+ T cells, LAG3+ PD-1+ CD8+ T cells in the BM of mice intravenously inoculated with 2×10⁶ 5TGM1-luc cells and treated with intraperitoneal injections of control IgG or αPD-1 on day 14 and day 17. Analysis was done on day 18 after the tumor injection (n=5). (E) Percentages of CD3+ T cells and LAG3+ PD-1+ CD8+ T cells in the BM of mice intravenously inoculated with 0.5×10⁶ Vk*MYC cells and treated with intraperitoneal injections of control IgG or αPD-1 on day 14 and day 17. Analysis was done on day 18 after the tumor injection (n=6). (F) CyTOF analysis showing the representative t-SNE display of cell composition in the BM of Vk*MYC-bearing or 5TGM1-bearing mice (n=3). Data are presented as mean±SD. *P<0.05; **p<0.01; ***p<0.001. BM, bone marrow; CyTOF, cytometry by time of flight; MM, multiple myeloma; NK, natural killer; PMN-MDSCs, polymorphonuclear myeloid-derived suppressor cells; PD-1, programmed cell death protein 1; PD-L1, programmed death ligand 1; TME, tumor microenvironment; t-SNE, t-distributed stochastic neighbor embedding.
As the antitumor activity of ICB-reactivated T cells is hindered by the immunosuppressive cells,13 27 we analyzed the populations of immune suppressive cells in the BM of Vk*MYC-bearing and 5TGM1-bearing mice. Results showed that the numbers of macrophages/TAMs and PMN-MDSCs were significantly increased in the BM of Vk*MYC-bearing mice compared with 5TGM1-bearing mice (figure 2F). These results suggest that the presence of the immunosuppressive cells in TME may be responsible for inhibiting PD-1 ICB-induced T cell response in MM.
Depleting TAMs and Treg cells inhibits tumor growth without affecting the response to PD-1 ICB in Vk*MYC MM
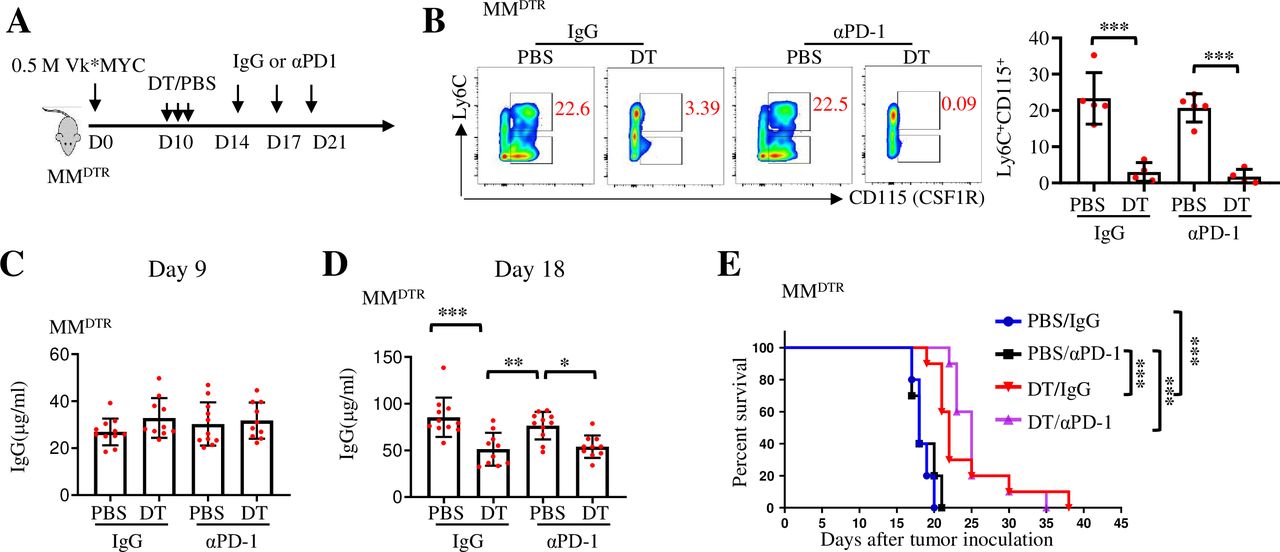
We previously reported that depleting TAMs by CSF1R blockade inhibited MM growth in 5TGM1 MM model.4 Our CyTOF analysis showed that the number of TAMs in the BM of Vk*MYC MM mice was higher than that in 5TGM1 MM mice (figure 2F). Therefore, we first explored whether depleting TAMs could improve the therapeutic effects of PD-1 ICB in Vk*MYC MM model. For this purpose, we used the LysmCrexCsfrLSL-DTR (MMDTR) mouse model,32 as injection of diphtheria toxin (DT) into MMDTR mice depletes all monocytes and macrophages without affecting dendritic cells or lymphocytes, allowing for the study of the role of monocytes and macrophages in inflammation and immunity.32 By injecting Vk*MYC MM cells into MMDTR mice, we tested the therapeutic effect of PD-1 inhibitor in the mice (figure 3A). In line with previous studies,4 32 33 macrophages in MMDTR mice were efficiently depleted in vivo after DT injection (figure 3B). Before DT injection, tumor burdens, detected by serum IgG concentration, in each group were similar (figure 3C). Although depletion of macrophages significantly inhibited tumor growth and prolonged mouse survival as we reported before,4 the combination of PD-1 inhibitor and macrophage depletion did not achieve a better antitumor efficacy than macrophage depletion alone (figure 3D,E). Similar results were obtained in MMDTR mice inoculated with a larger number of Vk*MYC MM cells (online supplemental figure 2A–D). These results indicate that macrophage-depleting monotherapy can be used to treat MM, but depleting macrophages does not sensitize Vk*MYC MM-bearing mice to anti-PD-1 therapy.

Depleting macrophages inhibits tumor growth without affecting the response to PD-1 inhibitors in Vk*MYC multiple myeloma (MM). (A) MMDTR mice were inoculated intravenously with 0.5×10⁶ Vk*MYC cells and, randomly received intraperitoneal injections of PBS or DT on day 10, followed by the treatment with IgG or αPD-1. (B) The efficacy of macrophage depletion in DT-treated or PBS-treated mice on day 18 after tumor cell inoculation (n=5). (C, D) Tumor burden is shown as serum IgG levels measured by ELISA on day 9 and day 18 after tumor cell inoculation (n=10–11). (E) Kaplan-Meyer survival plots of treated mice (n=10). Data are presented as mean±SD. *P<0.05; **p<0.01; ***p<0.001. DT, diphtheria toxin; MM, multiple myeloma; PD-1, programmed cell death protein 1.
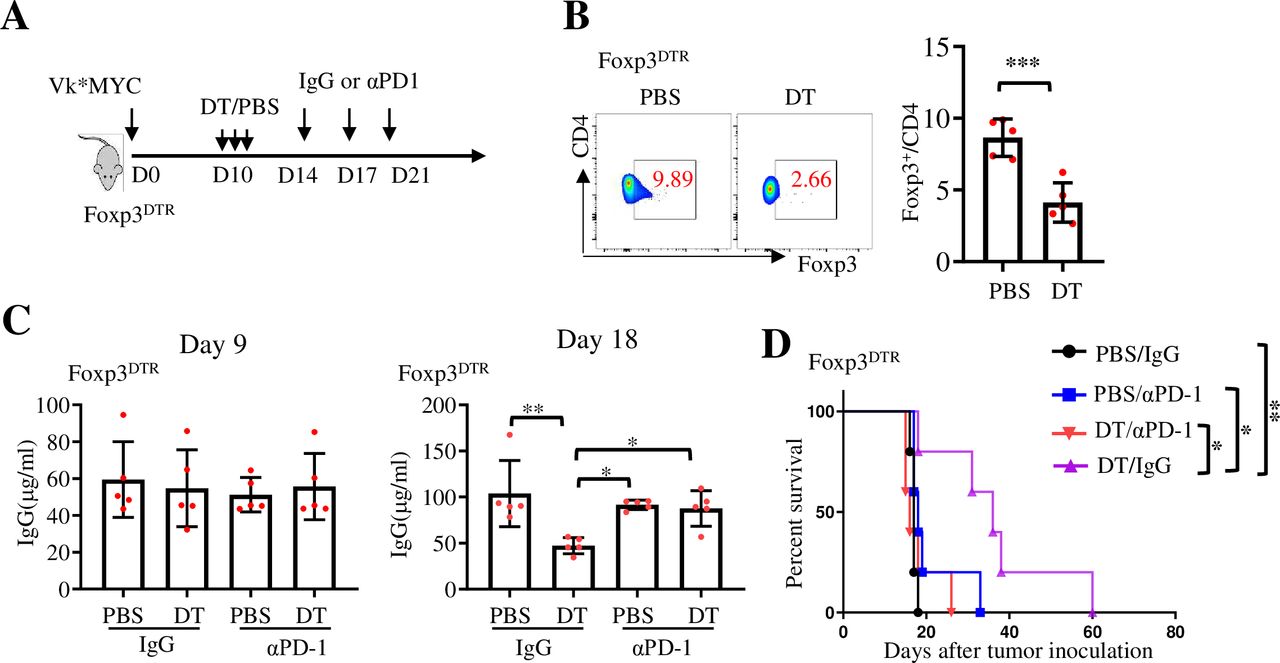
Treg cells restrict clinical progression in individuals with cancer.34 To determine whether Tregs cells influence MM response to PD-1 inhibitor, Foxp3DTR (Foxp3-DTR/EGFP)23.2Spar/Mm) mice,35 which express DT receptor under the control of Foxp3 gene, were used and injected with Vk*MYC MM cells (figure 4A). DT administration to Foxp3DTR mice ablates Foxp3+CD4+ Treg cells with no apparent effect on CD25+ effector T cells.35 Consistent with a previous study,36 the number of Treg cells in Vk*MYC-bearing Foxp3DTR mice was significantly decreased on DT injection (figure 4B). The tumor burden in each group was similar before DT injection, and depletion of Treg cells by DT injection also significantly inhibited tumor growth. However, injection of αPD-1 antibody did not improve, but rather slightly compromised, the antitumor effect of Treg cell depletion (figure 4C,D). Thus, these findings suggest that depleting macrophages/TAMs or Treg cells inhibits tumor growth without enhancing the response to PD-1 inhibitors in Vk*MYC-bearing mice.

Depleting Treg cells inhibits tumor growth without enhancing the response to PD-1 inhibitors in Vk*MYC MM. (A) Foxp3DTR mice were inoculated intravenously with 0.5×10⁶ Vk*MYC cells and, randomly received intraperitoneal injections of PBS or DT on day 10, followed by the treatment with IgG or αPD-1. (B) The efficacy of Treg cell depletion in DT-treated or PBS-treated mice on day 18 after tumor cell inoculation (n=5). (C) Serum IgG levels were measured by ELISA on day 9 and day 18 after tumor cell inoculation (n=5). (D) Kaplan-Meyer survival plots of treated mice. Data are presented as mean±SD. *P<0.05; **p<0.01; ***p<0.001. DT, diphtheria toxin; MM, multiple myeloma; PD-1, programmed cell death protein 1.
Depleting MDSCs sensitizes Vk*MYC and enhances 5TGM1 MM response to PD-1 ICB
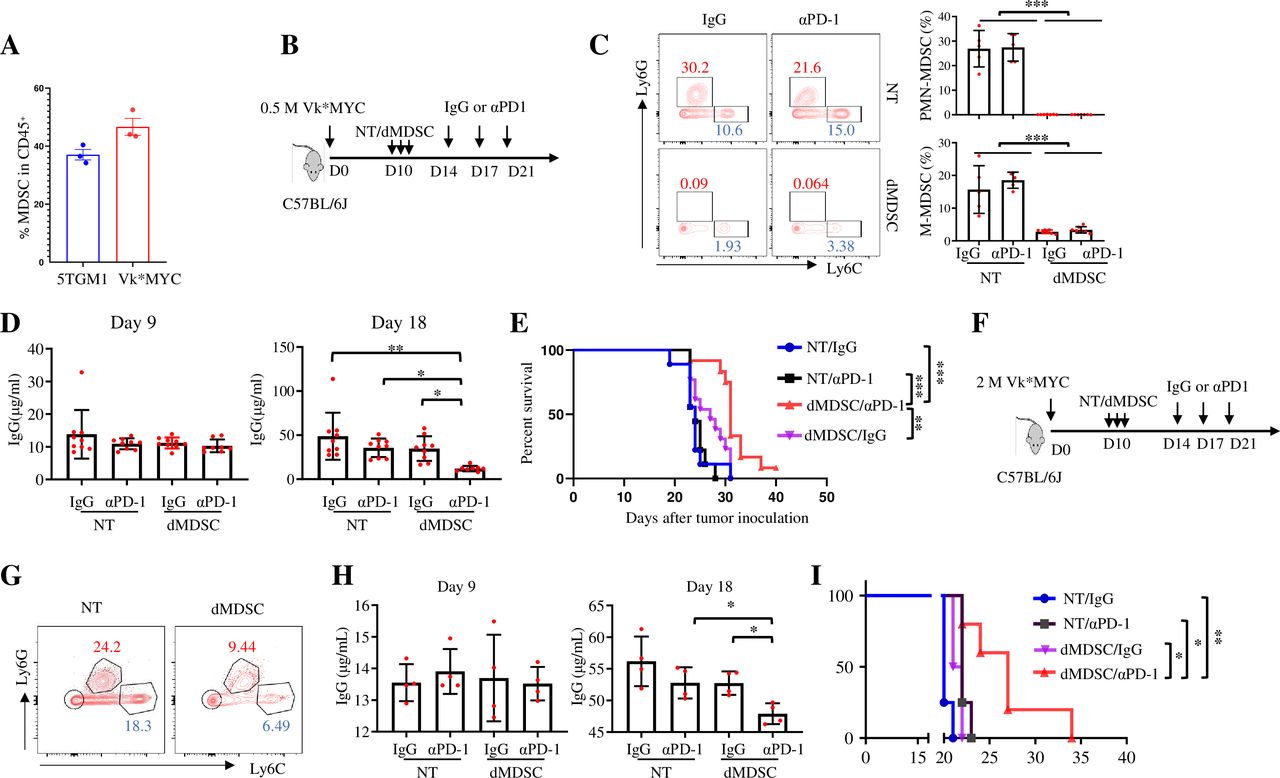
MDSCs play an important role in immune suppression and tumor progression in MM.37 Our CyTOF analysis revealed that the number of PMN-MDSCs in Vk*MYC MM-bearing mice was significantly higher than that in 5TGM1-bearing mice (figure 2F). MDSCs accounted for about half of the total CD45+ cells in the BM (figure 5A). To determine whether MDSCs depletion would affect MM response to PD-1 inhibitor, we used peptide-Fc fusion proteins (peptibodies) to deplete MDSCs (figure 5B), including both PMN-MDSCs and monocytic MDSCs (M-MDSCs), as previously reported.38 Consistent with the prior study,38 the numbers of PMN-MDSCs and M-MDSCs in the BM of Vk*MYC-bearing mice were significantly decreased after 3 days of continuous peptibody injections (figure 5C). We subsequently treated the mice with αPD-1 antibodies, and results showed that MDSCs depletion significantly reduced tumor burden and extended the survival of Vk*MYC MM-bearing mice treated with αPD-1 antibodies, although MDSCs depletion alone did not affect tumor growth (figure 5D,E). Moreover, even with a high-dose tumor cell inoculation, MDSCs depletion also sensitized Vk*MYC-bearing mice to PD-1 ICB (figure 5F–I).

Depleting MDSCs sensitizes Vk*MYC MM to PD-1 ICB treatment. (A) Percentages of MDSCs in CD45+ cells from the BM of 5TGM1-bearing and Vk*MYC-bearing mice on day 21 after tumor cell inoculation. (B) C57BL/6J mice were inoculated intravenously with 0.5×10⁶ Vk*MYC cells and, randomly received intraperitoneal injections of irrelevant peptides (NT) or peptibodies to deplete MDSCs (dMDSC) on day 10, followed by the treatment with IgG or αPD-1. (C) The efficacy of MDSCs depletion in irrelevant peptides-(NT) or peptibodies-(dMDSC) treated mice in BM on day 13 after tumor cell inoculation (n=5–7). (D) Serum IgG levels were measured by ELISA on day 9 and day 18 after tumor cell inoculation (n=8–9). (E) Kaplan-Meyer survival plots of treated mice (n=9–13). Data shown are representative of two independent experiments. (F) C57BL/6J mice were inoculated intravenously with 2×10⁶ Vk*MYC cells and randomly received intraperitoneal injections of irrelevant peptides or peptibodies to deplete MDSCs on day 10, followed by the treatment with IgG or αPD-1. Shown are (G) the efficacy of MDSCs depletion in irrelevant peptides-treated or peptibodies-treated mice BM on day 13 after tumor cell inoculation, (H) serum IgG levels measured by ELISA on day 9 and day 18 after tumor cell inoculation (n=4), and (I) Kaplan-Meyer survival plots of treated mice (n=4–5). Data are presented as mean±SD. *P<0.05; **p<0.01; ***p<0.001. BM, bone marrow; ICB, immune checkpoint blockade; MDSCs, myeloid-derived suppressor cells; MM, multiple myeloma; PD-1, programmed cell death protein 1.
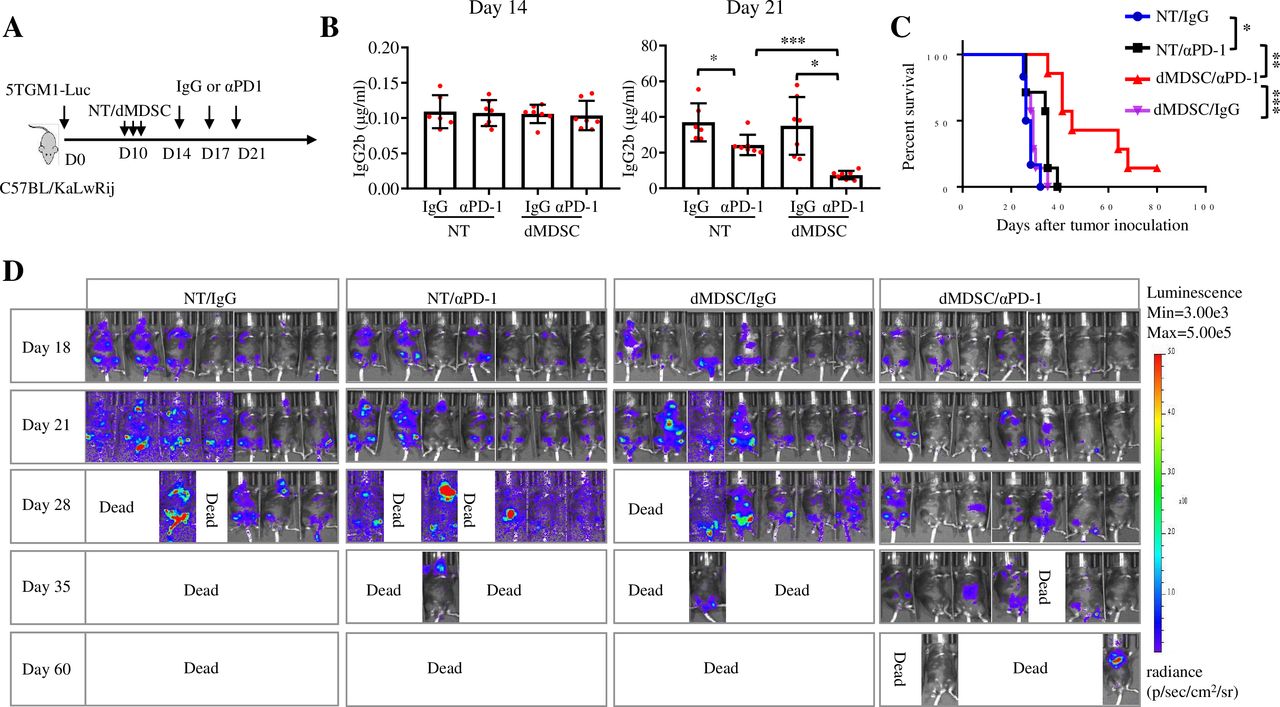
To confirm this result, we depleted MDSCs in 5TGM1-bearing mice (figure 6A). While 5TGM1-bearing mice were responsive to PD-1 ICB, depletion of MDSCs further improved the therapeutic efficacy of PD-1 inhibitor, leading to a markable delay in MM progression and prolonged mouse survival (figure 6B–D). Collectively, these results indicate that MDSCs may be responsible for inhibiting the therapeutic effects of PD-1 inhibitors in MM and depleting MDSCs may be a promising strategy to sensitize patients with MM to ICB treatment.

Depleting MDSCs improves the therapeutic efficacy of PD-1 inhibitor in 5TGM1 MM. (A) C57BL/KaLwRij mice were inoculated intravenously with 2×10⁶ 5TGM1-luc cells and, randomly received intraperitoneal injections of irrelevant peptides (NT) or peptibodies (dMDSC) on day 10, followed by the treatment with IgG or αPD-1. (B) Serum IgG2b levels were measured by ELISA on day 9 and day 18 after tumor cell inoculation (n=6–7). (C) Kaplan-Meyer survival plots of treated mice (n=6–7). (D) Bioluminescence imaging was used to monitor tumor growth progression on indicated days (n=7). Data are presented as mean±SD. *P<0.05; **p<0.01; ***p<0.001. MDSCs, myleoid-derived suppressor cells; MM, multiple myeloma; PD-1, programmed cell death protein 1.
CD8+ T cells are required for the restored response to PD-1 ICB induced by MDSCs depletion in Vk*MYC MM
To identify the primary executor responsible for PD-1 ICB response after MDSCs depletion in murine MM, mice deficient in CD4+ or CD8+ T cells were used by inoculating Vk*MYC MM cells followed by peptibodies treatment to deplete MDSCs and injection of αPD-1 antibodies (figure 7A and online supplemental figure 3A,D). First, neither αPD-1 nor peptibodies treatment alone affected tumor growth in wild type (WT), CD4−/−, or CD8−/− mice (online supplemental figure 3B–F). In addition, compared with wild-type mice, CD4+ T cell deficiency had no significant impact on the restored response to PD-1 inhibitors induced by MDSCs depletion (online supplemental figure 3G–I). However, CD8+ T cell deficiency abolished the restored response of PD-1 inhibitors induced by MDSCs depletion, which was accompanied by increased tumor burden and shortened mouse survival compared with treated WT mice (figure 7B,C). These findings suggest that CD8+ but not CD4+ T cells are the main effector T cells that were activated by PD-1 inhibitors in the MM scene.

CD8+ T cells are required for the restored PD-1 inhibitor response induced by MDSCs depletion in Vk*MYC MM. (A) WT or CD8−/− C57BL/6J mice were inoculated intravenously with 0.5×10⁶ Vk*MYC cells and randomly received intraperitoneal injections of irrelevant peptides or peptibodies on day 10, followed by the treatment with IgG or αPD-1. (B) Serum IgG levels were measured by ELISA on day 9 and day 18 after tumor cell inoculation (n=5). (C) Kaplan-Meyer survival plots of treated mice (n=5–7). (D–E) PMN-MDSCs (CD45+ CD11b+ Ly6G+ Ly6C−) and M-MDSCs (CD45+ CD11b+ Ly6G− Ly6C+) were sorted out from Vk*MYC tumor-bearing (MM) or tumor-free mice and cocultured with tumor-free mouse-derived CD8+ T cells stimulated by CD3/CD28 antibodies. After a 72-hour coculture, the proliferation (CFSE) inhibition and cytokine (IFNγ and TNFα) secretion of CD8+ T cells were determined. (F) C57BL/6J mice were inoculated intravenously with 0.5×10⁶ Vk*MYC cells or PBS, and the percentage of CD84+ PMN-MDSCs and CD84+ M-MDSCs in the BM of tumor-free or Vk*MYC MM-bearing mice. (G) CD84+ MDSCs and CD84– MDSCs were sorted out, cocultured with splenocytes at a ratio of (MDSCs: splenocytes) 1:4 and treated with αPD-1. After a 72-hour coculture, the percentages of intracellular IFNγ and TNFα positive CD8+ T cells were determined. Data are presented as mean±SD. *P<0.05; **p<0.01; ns, not significant. BM, bone marrow; CFSE, carboxyfluorescein diacetate succinimidyl ester; IFNγ interferon γ; MDSCs, myelood-derived suppressor cells; MM, multiple myeloma; PD-1, programmed cell death protein 1; PMN, polymorphonuclear; TNFα, tumor necrosis factor α.
MDSCs are a diverse population of immature myeloid cells, categorized into two subsets: PMN-MDSCs and M-MDSCs. To determine which subset possesses a suppressive activity, we isolated BM PMN-MDSCs (CD45+ CD11b+ Ly6G+ Ly6C−) and M-MDSCs (CD45+ CD11b+ Ly6G− Ly6C+) from tumor-bearing or tumor-free mice. These cells were then cocultured with CD8+ T cells derived from tumor-free mice. We observed that MDSCs, especially M-MDSCs from tumor-bearing mice, potently suppressed CD8+ T cell proliferation and function (figure 7D,E). Additionally, it was reported that CD84 is highly expressed on MDSCs and is involved in their immunosuppressive function in breast cancer and MM.16 39 However, whether CD84+ MDSCs affect CD8+ T cell response to PD-1 inhibitors in MM is unknown. Our results showed that the expression of CD84 was increased on both PMN-MDSCs and M-MDSCs from the BM of Vk*MYC-bearing mice compared with tumor-free mice (figure 7F). To explore whether CD84+ MDSCs would restrain the activation of CD8+ T cells in the TME, we sorted out CD84+ and CD84− MDSCs from the spleens of Vk*MYC-bearing mice and cocultured them with CD8+ T cells in the presence of αPD-1 antibodies. Compared with CD84– MDSCs, CD84+ MDSCs significantly suppressed the production of IFNγ and TNFα by CD8+ T cells (figure 7G). These findings indicate that MDSCs, especially M-MDSCs and CD84+ MDSCs, play a suppressive role in CD8+ T cell activation in response to PD-1 inhibitors in murine MM.
Expressions of MDSCs and cytotoxic CD8+ T cell signature genes are negatively correlated in patients with MM
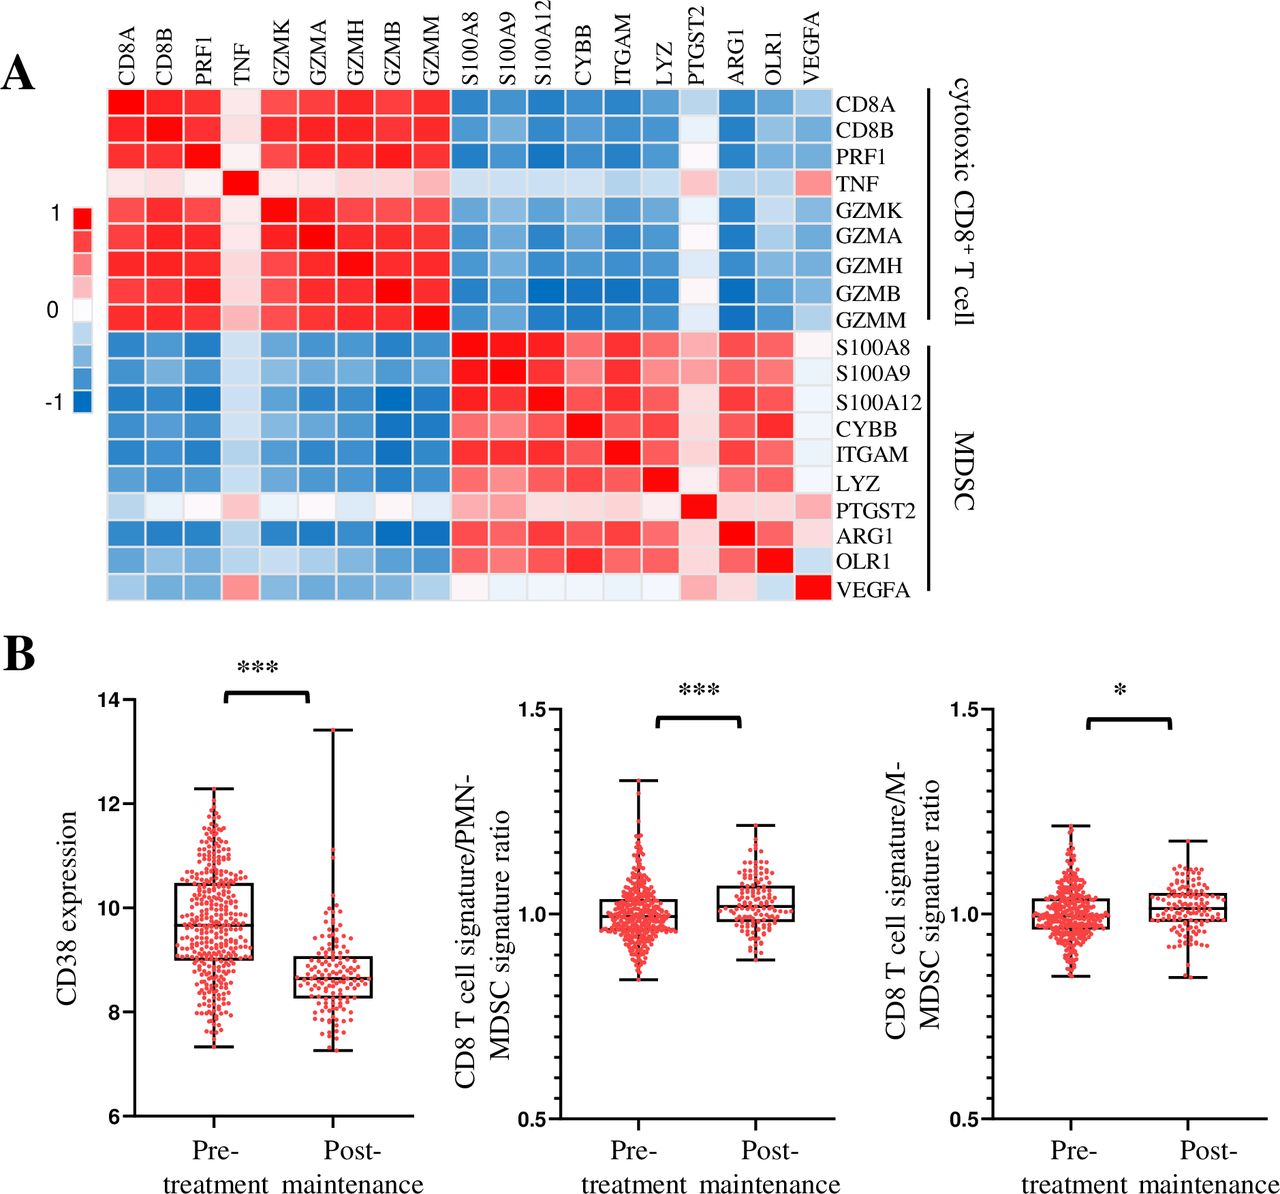
To determine the clinical relevance of our findings to human MM, we analyzed gene expression profiles of CD138– BM aspirate cells from 73 newly diagnosed MM in a previously reported study.31 Interestingly, we found that there was a negative correlation between MDSCs signature genes and cytotoxic CD8+ T cell signature genes in the TME (figure 8A). In addition, when we analyzed the gene expression profiles of BM aspirate cells from pretreated and treated post-maintenance patients with MM,40 we found that the expression of CD38, a marker gene of MM cells, was decreased after treatment. Furthermore, the ratio of cytotoxic CD8+ T cell to MDSCs signature genes was significantly increased (figure 8B). These results suggest that MDSCs dampen the cytotoxic CD8+ T cell functions in the TME of patients with MM and depleting MDSCs may be a potential strategy to sensitize human MM to ICB treatment.

Expressions of MDSCs and cytotoxic CD8+ T cells signature genes are negatively correlated in human patients with MM. (A) Analyses of gene-profiling data of CD138– BM aspirate cells from GSE104171. Heatmap shows a negative correlation between the cytotoxic CD8+ T cell signature genes and MDSCs signature genes in patients with MM. (B) Analyses of gene-profiling data from GSE136324 show the expressions of CD38, the ratio of cytotoxic CD8+ T cell to PMN-MDSCs signature genes, and the ratio of cytotoxic CD8+ T cell to M-MDSCs signature genes in pretreated and treated post-maintenance patients with MM. Data are presented as mean±SD. *P<0.05; ***p<0.001. BM, bone marrow; MDSCs, myeloid-derived suppressor cells; MM, multiple myeloma; PMN, polymorphonuclear.
Discussion
Although ICB has achieved unprecedented success in the treatment of patients with cancer, positive results have rarely been reported in human MM clinical trials. In this study, we showed that MDSCs are the dominant immunosuppressive cells impeding the function of CD8+ T cells in murine MM models. We discovered that selectively depleting MDSCs, rather than Tregs or TAMs, enhances the response of Vk*MYC mice to PD-1 inhibitors and amplifies the anti-tumor effects in 5TGM1-bearing mice. Furthermore, gene expression analysis in patients with MM revealed an inverse relationship between MDSCs signature genes and cytotoxic CD8+ T cell signature genes, with an increased ratio of cytotoxic CD8+ T cell to MDSCs signature gene ratio in treated post-maintenance patients with MM. Hence, our study provides preclinical evidence that targeting MDSCs may be a promising strategy to overcome resistance to ICB in human MM.
MDSCs are one of the major immunosuppressive components in the TME and their role in MM pathogenesis has been documented.31 41 Yet, their impact on the efficacy of ICB therapies in MM remains to be understood. Our results showed that depleting MDSCs using peptide-Fc fusion proteins improved the responses to PD-1 inhibitors in murine MM, with the presence of CD8+ T cells being essential for this improved efficacy. In line with our findings, reduction of MDSCs in solid tumors significantly activated the antitumor ability of cytotoxic T-lymphocyte-associated protein 4 (CTLA-4) and PD-1 ICB and led to tumor eradication in ICB-resistant CT26 and 4T1 tumors.41 42 Even in ICB-responsive tumors, MDSCs depletion resulted in a significant improvement of mouse survival compared with PD-1 inhibitors alone in murine Lewis lung, renal cell carcinoma and melanoma models.43 44 Collectively, these studies suggest that MDSCs may contribute to resistance to ICB for patient with cancer and combining MDSCs depletion with ICB holds promise for improving the therapeutic efficacy in ICB-resistant patients with MM.
Although monotherapy with PD-1 inhibitors has yielded disappointing results in MM, combining these inhibitors with other treatments has shown some promise.45 46 For example, a study combining Belapecti, a Galectin-3 inhibitor, with pembrolizumab (an anti-PD-1 therapy) demonstrated synergistic effects in MM.47 The study observed increased Gal-3 expression, expansion of effector memory T cells, and decreased M-MDSCs, all of which correlated with improved clinical response.47 Nonetheless, further clinical evidence is required to confirm these outcomes. In addition, identifying MDSCs in the human TME is challenging due to the lack of cell surface markers distinguishing them from other myeloid cells. Although commonly used markers such as CD33 and CD14 are employed for MDSCs identification in humans, they are not unique to MDSCs and are also expressed on other myeloid cells, including neutrophils, monocytes and macrophages.48
In addition to MDSCs, Treg cells and TAMs are also important immunosuppressive cells in the TME and promote tumor progression in cancers. Our results showed that depletion of TAMs or Treg cells alone could significantly inhibit tumor growth in murine MM. However, depleting these cells had no effect on improving the therapeutic effect of PD-1 inhibitors in murine MM. Treg cell depletion can be achieved by different methods and we used DT receptor-induced Fopx3 depletion in this study. In fact, some preclinical studies used anti-CD25 antibody to deplete Treg cells. A recent study reported that Treg cell depletion by anti-CD25 antibodies reversed immunotherapy resistance in murine MM and resulted in a prolonged tumor control.30 However, they also showed that patients with a high CD8+ T: Treg cell ratio exhibited a shorter time in progression to active MM and early relapse in comparison with patients with a low CD8+ T: Treg cell ratio.30 As CD25 expression is also upregulated on activated effector CD8+ and CD4+ T cells,49 the therapeutic effects of anti-CD25 antibodies need to be further investigated. To increase targeting specificity, one group has optimized an anti-CD25 antibody by enhancing its binding activity to FcγRs.50 This allows for selective depletion of tumor-infiltrating Treg cells and may be a valuable tool for exploring the role of Tregs in tumor growth.
By analyzing clinical gene-profiling data, we noticed that the expression of MDSCs signature genes was negatively correlated with cytotoxic CD8+ T cell signature genes in patients with MM, suggesting that MDSCs might dampen cytotoxic CD8+ T cell functions in MM TME. This hypothesis is supported by our in vitro study, which showed that CD84+ MDSCs significantly inhibited the activation and cytotoxic cytokine production of CD8+ T cells. This finding aligns with a recent study suggesting that CD84 expression on MDSCs might play a role in their immunosuppressive functions within the TME.39 Consistently, Nakamura et al reported that PMN-MDSCs limited T cell responses and exhibited suppressive activity on MM patient-derived CD4+ and CD8+ T cells,31 highlighting the value of an elevated ratio of tumor-reactive CD8+ T cells to immunosuppressive MDSCs in the BM as a predictor of immunotherapy responses. However, the precise mechanism underlying the suppression of MDSCs on CD8+ T cells in MM remains unclear, and further investigation is warranted.
In summary, our results reveal that depleting MDSCs sensitizes murine MM to PD-1 inhibitors and this response is dependent on CD8+ T cells. This study provides important insight into enhancing the therapeutic efficacy of ICB in human MM.
Data availability statement
All data relevant to the study are included in the article or uploaded as supplementary information.
Ethics statements
Patient consent for publication
Ethics approval
All studies were approved by the Institutional Animal Care and Use Committee of the Houston Methodist Research Institute (#A-4555-01).
References
Footnotes
WX and LX contributed equally.
Contributors QY, WX, and LX initiated the study, designed the experiments, and wrote the manuscript. LX and WX performed most experiments and statistical analyses. RD, QW and PS helped with animal studies and CyTOF analysis. MX, LZ, CZ, YL, JQ, and CZ provided reagents and important suggestions. QY is responsible for the overall content as guarantor.
Funding This work was supported by Startup Support from Houston Methodist Research Institute, Houston Methodist Hospital, by Cancer Prevention & Research Institute of Texas (CPRIT) Recruitment of Established Investigator Award (RR180044), and by NCI R01s CA214811and CA200539. QY and his research group are also supported by NCI R01s (CA239255, CA282099, CA278787 and CA2855209) and CPRIT High-Impact/High-Risk Research Award (RP210868).
Competing interests None declared.
Provenance and peer review Not commissioned; externally peer reviewed.
Supplemental material This content has been supplied by the author(s). It has not been vetted by BMJ Publishing Group Limited (BMJ) and may not have been peer-reviewed. Any opinions or recommendations discussed are solely those of the author(s) and are not endorsed by BMJ. BMJ disclaims all liability and responsibility arising from any reliance placed on the content. Where the content includes any translated material, BMJ does not warrant the accuracy and reliability of the translations (including but not limited to local regulations, clinical guidelines, terminology, drug names and drug dosages), and is not responsible for any error and/or omissions arising from translation and adaptation or otherwise.