Article Text

Abstract
Background Chromosomal rearrangements have profound consequences in diverse human genetic diseases. Currently, the detection of balanced chromosomal rearrangements (BCRs) mainly relies on routine cytogenetic G-banded karyotyping. However, cryptic BCRs are hard to detect by karyotyping, and the risk of miscarriage or delivering abnormal offspring with congenital malformations in carrier couples is significantly increased. In the present study, we aimed to investigate the potential of single-molecule optical genome mapping (OGM) in unravelling cryptic chromosomal rearrangements.
Methods Eleven couples with normal karyotypes that had abortions/affected offspring with unbalanced rearrangements were enrolled. Ultra-high-molecular-weight DNA was isolated from peripheral blood cells and processed via OGM. The genome assembly was performed followed by variant calling and annotation. Meanwhile, multiple detection strategies, including FISH, long-range-PCR amplicon-based next-generation sequencing and Sanger sequencing were implemented to confirm the results obtained from OGM.
Results High-resolution OGM successfully detected cryptic reciprocal translocation in all recruited couples, which was consistent with the results of FISH and sequencing. All high-confidence cryptic chromosomal translocations detected by OGM were confirmed by sequencing analysis of rearrangement breakpoints. Moreover, OGM revealed additional complex rearrangement events such as inverted aberrations, further refining potential genetic interpretation.
Conclusion To the best of our knowledge, this is the first study wherein OGM facilitate the rapid and robust detection of cryptic chromosomal reciprocal translocations in clinical practice. With the excellent performance, our findings suggest that OGM is well qualified as an accurate, comprehensive and first-line method for detecting cryptic BCRs in routine clinical testing.
- chromosome aberrations
- reproductive health
- genetic testing
- in situ hybridization, fluorescence
- chromosome banding
Data availability statement
The original contributions presented in the study are included in the article/Supplemental Materials, further inquiries can be directed to the corresponding author/s.
Statistics from Altmetric.com
- chromosome aberrations
- reproductive health
- genetic testing
- in situ hybridization, fluorescence
- chromosome banding
What is already known on this topic
Cryptic balanced chromosomal rearrangements (BCRs), while hard to be detected by routine karyotyping technology, can significantly increase the risk of delivering abnormal offspring with congenital malformations or miscarriage in carrier couples.
Although FISH can unravel cryptic BCRs, the prerequisite is to acquire the chromosome microarray/CNV-sequencing results of the carrier’s abortions/affected offspring with chromosome imbalances and loci specific fluorescent probes, which restricts its clinical application.
What this study adds
With this initial research, our results suggested that optical genome mapping (OGM) technology could accurately detect cryptic BCRs and all high-confidence cryptic reciprocal translocations detected by OGM were confirmed by FISH and sequencing analysis.
Moreover, OGM can reveal additional complex rearrangement events, such as inverted insertions, further refining potential genetic interpretation.
How this study might affect research, practice and/or policy
OGM will improve the diagnostic rate of cryptic BCRs and streamline the process of detection, and OGM can be used as a first-line method in routine clinical testing.
Introduction
Chromosomal structural rearrangements, frequently generated by recombination errors during DNA repair, have profound consequences in diverse human diseases.1 2 The frequency of chromosomal rearrangements is approximately 0.6% in unselected newborns.3 Unbalanced chromosomal aberrations can result in abortion or severe disorders in the newborn, characterised by congenital malformation and developmental anomaly. Balanced translocations are the most common subgroups in clinical patients, with a prevalence of approximately one in 370 individuals, while the incidence is substantially higher in couples with recurrent miscarriages (up to 4.1%).4 5 Although most BCR carriers are phenotypically normal, their risk of miscarriage or delivering newborns with chromosomal imbalances is increased due to the unbalanced gametes generated by recombinant chromosomes during meiosis.6 In addition, a small subgroup of carriers is at risk for neurodevelopmental or other neuropsychiatric conditions, possibly due to the interruption of gene areas or topologically associated domains.7 8
Apparent chromosomal rearrangements can be accurately detected by G-band karyotyping. However, karyotyping is limited to a microscopic resolution of ~5–10 Mb, which renders cryptic rearrangements below this resolution hard to identify. Chromosome microarray (CMA) analysis allows a higher resolution screening for unbalanced cryptic aberrations than karyotyping, but microarray-based technologies are incapable of detecting balanced genomic alterations. Moreover, cryptic BCRs are undetectable by these routine analyses. To identify suspected cryptic BCRs, FISH can be performed based on the outcome of the CMA analysis of abortion tissues or the blood of offspring with chromosome imbalances. FISH is a feasible way to visualise and map genomic abnormalities on a cell-by-cell basis, while its application is restricted by the necessity of knowing loci a priori and using specific fluorescent probes.9 In addition, although low-depth whole-genome sequencing (WGS) and long-read sequencing can identify cryptic BCRs, the detection rate of such technologies is imperfect and missed diagnosis is inevitable.10 11 The rearrangements with breakpoints located in highly repetitive or complex regions are difficult to identify, obstructing the unique mapping and chromosomal rearrangements testing in both short-read and long-read sequencing.12 Moreover, the reads resulting from long-read sequencing technologies may also generate high assembly error rates and these technologies are cost-prohibitive.13 14 Therefore, a rapid and robust technique is required to survey cryptic chromosomal rearrangements during clinical testing.
Optical genome mapping (OGM) is an attractive all-in-one approach for detecting chromosomal aberrations with high specificity and sensitivity, including aneuploidies and unbalanced and balanced structural rearrangements.15 This method is based on optical mapping, a preamplification-free high-resolution technique that images ultra-long DNA molecules tagged at specific sequence motifs throughout the genome.16 Currently, OGM has demonstrated its capacity to unravel pathogenic structural variations (SVs) in cancers, including hereditary breast cancer and multiple myeloma, and in nucleotide repeat expansion/contraction disorders, such as Duchenne muscular dystrophy (DMD) and facioscapulohumeral muscular dystrophy (FSHD).17–20 Recent work has illustrated the potential of OGM in replacing Southern blotting for D4Z4 repeat sizing and haplotyping in FSHD, even in a low-level mosaic state.21 In another study, OGM showed 100% concordance with a combination of cytogenetic assays for detecting genomic chromosomal aberrations in 85 individuals.15 In case of apparently balanced genomic aberrations, OGM has enabled the characterisation of breakpoints in patients with acute myeloid leukaemia,22 patients with acute lymphoblastic leukaemia23 and subfertile individuals carrying previously detected balanced translocations.24 Moreover, OGM has the potential to identify novel and high levels of complex genetic abnormalities, such as chromoanagenesis and marker chromosomes, which increases the diagnostic yield of such conditions.25 26
Important challenges have so far limited the unbiased survey of cryptic BCRs, which can highly increase the risk of delivering affected offspring with unbalanced rearrangements. However, cryptic rearrangements are hard to detect by current routine clinical methods, such as karyotyping. In this present study, we aim to investigate the potential of OGM technology to detect possible cryptic rearrangements in patients, providing new insights for clinical application.
Materials and methods
Patient enrolment
Eleven couples who presented apparently normal karyotypes and underwent assisted reproductive technology procedures were recruited for the present study (online supplemental table 1). All these couples had an abnormal pregnancy history that their abortions or affected offspring were diagnosed with unbalanced chromosomal rearrangements on the basis of CMA/CNV-sequencing results, and all the unbalanced rearrangements in this study included one terminal deletion segment and one terminal duplication segment. Peripheral blood samples (10 mL) were collected from the patients.
Supplemental material
High molecular weight DNA isolation and DNA labelling
High molecular weight (HMW) genomic DNA (gDNA) was extracted from fresh blood samples collected in EDTA-stabilised anticoagulative tubes using the Bionano Prep SP Blood and Cell Culture DNA Isolation Kit (#80030; Bionano Genomics, San Diego, California, USA). Briefly, blood cells were treated with lysis-and-binding buffer to release the HMW gDNA, which was then bound to a nanobind disk, washed and eluted in the elution buffer. The integrity and size of the isolated gDNA were validated by pulsed-field gel electrophoresis. HMW gDNA quantification was then performed using Qubit dsDNA assay BR kits in a Qubit 3.0 Fluorometer (Thermo Fisher Scientific, Waltham, Massachusetts, USA).
For DNA labelling, HMW gDNA molecules were labelled with the direct label (DL) and Stain DNA Labeling Kit (Bionano Genomics). Direct label enzyme 1 (DLE-1) and DL-green fluorophores were used to label 750 ng of gDNA. After washing out excess DL-green fluorophores, the gDNA backbone was counterstained with DNA stain, 5× Dithiothreitol (DTT) and 4×flow buffer for 1 hour and homogenised overnight at 4°C before quantitation and visualisation on a Saphyr instrument (Bionano Genomics).
Data collection and bioinformatics analysis
The labelled gDNA was loaded on a Saphyr chip (Bionano Genomics) and analysed on a Saphyr instrument (Bionano Genomics). De novo genome map assembly was performed using Bionano Solve V.3.4 (Bionano Genomics). SVs (based on the assembled genome maps) and CNVs (based on molecular coverage) were called against the human reference genome (GRCh38/hg38). Analysis of these data was performed with Bionano Access and Bionano Tools on the Saphyr Compute Server (Bionano Genomics).
The filter settings were optimised on the basis of the data obtained before following prior analysis of the OGM analysis results to reduce CNVs. The following confidence values were applied: insertion/deletion: 0, inversion: 0.7, duplications: −1, intratranslocation: 0.3, intertranslocation: 0.65 and CNV: 0.99. For CNV calls, only segments >500 kb were considered. The minimal breakpoint region was defined by the boundary of the DLE mark location closest to the crossover points on each chromosome. Only rare SVs that were not reported in other population control samples were retained. The pipeline queries variants against Bionano’s human control sample SV database containing variants collected from ethnically diverse mapped human genomes with no reported disease phenotypes. One hundred seventy-nine DLE-1 datasets are included in the database and are classified as African, Admixed American, East Asian, European, South Asianand unknown.
Confirmation of OGM analysis by long-range-PCR, next-generation sequencing and Sanger sequencing
The long-range (LR)-PCR experiments were conducted using the KOD FX Neo High Efficient and Success Rate DNA polymerase according to the manufacturer’s recommended protocol (Toyobo, Japan). The annealing temperature was set at 68°C and the LR-PCRs were performed on the Eppendorf Master Cycler (Hamburg, Germany). To evaluate the LR-PCR amplification rate, the final PCR products were run on an agarose gel and visualised by staining with GelGreen Nucleic Acid Stain (Biotium, Hayward, California, USA).
The LC-PCR products were fragmented to 150–250 bp using Hieff Smearase (YEASEN, Shanghai, China) before sequencing, and library preparation was performed using the Hieff NGS OnePot DNA Library Prep Kit (YEASEN, Shanghai, China). Next-generation sequencing (NGS) of paired-end 150 bp fragments was then performed using the Illumina Hiseq4000 platform (Illumina, San Diego, California, USA).
Chromosomal rearrangements were verified by PCR-based 2×bidirectional direct Sanger sequencing using primers designed from the known sequences of the paired-end readings. The sequencing results were interpreted using CodonCode Aligner 10.0.1 (CodonCode, Massachusetts, USA).
FISH detection
Metaphase FISH analysis was performed on the peripheral blood samples obtained from the couples. Briefly, peripheral blood lymphocytes were centrifuged on cleaned slides (ethanol:ether=1:1), allowed to air dry overnight, washed with phosphate-buffered saline and gradually dehydrated in an ethanol series. A total of 330 lymphocytes (30 cells per sample) were collected for FISH analysis. Standard preparations were executed with commercially available FISH probes targeting chromosome-specific repeat clusters of DNA, according to the manufacturer’s instructions (Abbott Molecular, USA). Hybridisation buffer (final concentration: 2×saline-sodium citrate (SSC), 10% dextran sulfate and 25 mM sodium phosphate) was added to the probe cocktail at a volume of 10 μL. The double-strand probe mixture and fixed chromosome specimens were denatured together under a coverslip (18×18 mm) at 80°C for 5 min in an incubator. The slides were placed with samples to be hybridised in a humidified chamber in a hot-air oven (at 37°C) for 12 hours. The slides were then washed twice for 5 min with 60% formamide, 2×SSC at room temperature and 2×SSC twice for 10 min. 4',6-Diamidino-2-phenylindole was used as a chromosome counterstain. Photomicrographs were taken using a fluorescence microscope.
G-banding analysis
Conventional karyotyping analysis was performed on the peripheral blood samples collected in heparinised tubes. Isolated peripheral blood lymphocytes were cultured (106 cells/mL) in standard medium supplemented with 10% fetal calf serum and antibiotics at 37°C. After 72 hours of culture, standard cytogenetic techniques were applied to prepare metaphase cells. After 100 μL colchicine (20 μg/mL) was added for 1 hour, microscopic slides (GTG banding) were prepared. Metaphase cells were G-banded using trypsin and the Giemsa method. At least 20 cells in metaphase were analysed for normal karyotypes and at least 10 metaphases were analysed for abnormal karyotypes. Banded metaphases were karyotyped, and cytogenetic abnormalities were described according to the International System for Human Cytogenetic Nomenclature (ISCN) 2020.
CMA analysis
Tissues of abortions or blood samples from affected offspring were collected and gDNA was extracted for array-comparative genomic hybridisation analysis. After labelling the gDNA with Cy3 and Cy5 fluorophores for approximately 3 hours, it was resuspended in dextran sulfate hybridisation buffer and hybridised overnight. Samples were then washed and a vacuum centrifuge was used to dry the microarray slides. Laser scanning was performed on the dry samples using the CytoScan high-density array platform (Thermo Fisher Scientific). The data were analysed with the Chromosome Analysis Suite software package (Thermo Fisher Scientific) to analyse the extracted microarray data on chromosome loss or gain within all 24 chromosomes. DNA extraction and whole genome amplification were performed strictly according to the manufacturer’s protocols.
SNP-array analysis was performed with 200 ng of gDNA on the Illumina Infinium high-density assay platform, according to the manufacturer’s instructions. Briefly, DNA was digested, ligated to adapters and amplified by PCR. Samples were then purified with magnetic beads and further fragmented. Finally, all samples were labelled with biotin. After hybridisation, the arrays were washed and stained with streptavidin and antistreptavidin antibodies. The arrays were then scanned, and data were extracted from the scanned images. The GenomeStudio software (Illumina) was used for data processing and analysis. All detected CNVs were annotated according to the ISCN 2020 genome version GRCh38/hg38.
Results
Patient description
The detailed characteristics of rearrangements included in the current study are shown in online supplemental table 1. Patients 1–10 had cryptic BCRs and patient 11 had cryptic unbalanced chromosomal rearrangements. Cryptic translocations were diagnosed by OGM, on the basis of CMA results of abortions or blood samples of affected offspring, followed by validation using FISH. The results of the CMA are shown in table 1. Reasons for referral included recurrent miscarriages, a history of affected child/fetus with chromosome loss/gain and infertility. All samples met the quality control standards for cell counts, extracted DNA length and mapping count and length.
Detailed characterisations of the cryptic rearrangements in our study
Results of OGM and SV calling
OGM analysis was performed to detect clinically relevant chromosomal aberrations. A graphical representation of the workflow used in the present study is shown in online supplemental figure 1. High-resolution whole-genome optical imaging generated an average of 600 Gb (±103) of data per sample. The labelling density was 14–17/100 kb. The average N50 molecule length (≥150 kb) was 266 kb (±27), indicating that at least half of the genome was covered by molecules longer than 266 kb (on average) after discarding molecules smaller than 150 kb. The OGM of all samples resulted in an average mapping rate of 88.4% (±2.7%) and an average of 165-fold effective coverage (±14).
On average, SV calling identified 5989 SVs (±26) in each sample, and the vast majority of which corresponded to insertions and deletions (with an average of 4161 (±24) and 167 (±32), respectively) (online supplemental figure 2). Detected SVs that were common or prone to potential artefacts were filtered out (details of the filtering strategies are described in ‘Materials and methods’ section). Of all identified SVs, 536 high-confidence SVs were identified as rare. Filtering out the SVs present in the database comprising population control samples resulted in an average of 49 (±8) rare SVs per sample. Graphical representations of the different types of chromosomal aberrations are depicted in figure 1A.

Genome-wide visualisation of optical genome mapping (OGM) data and example of a balanced translocation. (A) Circos plot combining all the chromosomal structural rearrangements from all patients using OGM analysis. Visualisation plot shows translocations in the middle as lines from one chromosome to another. The inner ring presents copy number status. The next ring presents other types of SVs as coloured dots illustrate. The outer ring exhibits chromosomes from 1 to 24 (1 to 22, X, Y). (B) Circos plot and de novo SVs after filtering-out in sample 3. The circos plot shows chromosomes 19 and 22 connected with a pink line. SV, structural variant; INS, insertion; DEL, deletion; INV, inversion; DUP, duplication; TRA, translocation. (C) Karyogram showing a normal karyotype of sample 3. Black arrows indicate microscopic normal chromosome 19 and 22. (D) Genome map view showing the breakpoint junction (black arrow) of translocation t(19;22)(q13.43;q13.31) and mapping genes in GRCh38/hg38. Aberrant molecules support the translocation. (E) Genome maps supporting the translocation. The assembled genome map shows the terminal deletion of 19q and 22q. Breakpoints (red lines) are mapped to the respective chromosome ideogram. (F) B allele frequency (BAF) graph of the chromosomally unbalanced offspring of sample 3. In the BAF image, gain regions generated allelic imbalance, which was presented by four tracks. Loss regions were presented by only two tracks without intermediate values. Red boxes around the chromosome image represent gains (chr 19) and losses (chr 22), respectively.
Detection of cryptic translocations using OGM
Cryptic structural aberrations in the present study were successfully identified using OGM, including 10 balanced reciprocal translocations and 1 unbalanced translocation. An example of a balanced translocation (t(19;22)(q13.43;q13.31)) identified by OGM is shown in figure 1B–E. The B allele frequency (BAF) graph of the chromosomally unbalanced offspring delivered by case 3 illustrates the genomic gains and losses on chromosomes 19 and 22 (figure 1F). The genomic regions of gains and losses in the offspring were concordant with the maternal-rearranged segments.
Genomic rearrangements detectable by OGM may lead to potential gene interruptions or gene fusions. Within the mapped breakpoint regions, we identified the presence of 19 potentially disrupted genes (table 1). Notably, putative gene fusions, such as CFAP99-ZNF649, ZNF444-SMC1B and PRAMEF20-DERL2 were also identified by OGM analysis. Details of the potentially disrupted gene(s) and fusion gene mapping in breakpoint regions are shown in table 1. Coding genes and pseudogenes were both included. Twenty-one chromosomal rearrangement breakpoints were identified using OGM. Furthermore, the OGM analysis led to the identification of inverted translocation segment in one case 5, with one inverted connection of rearranged segments occurring in one derivative chromosome (online supplemental figure 3).
Cryptic rearrangements identified by FISH
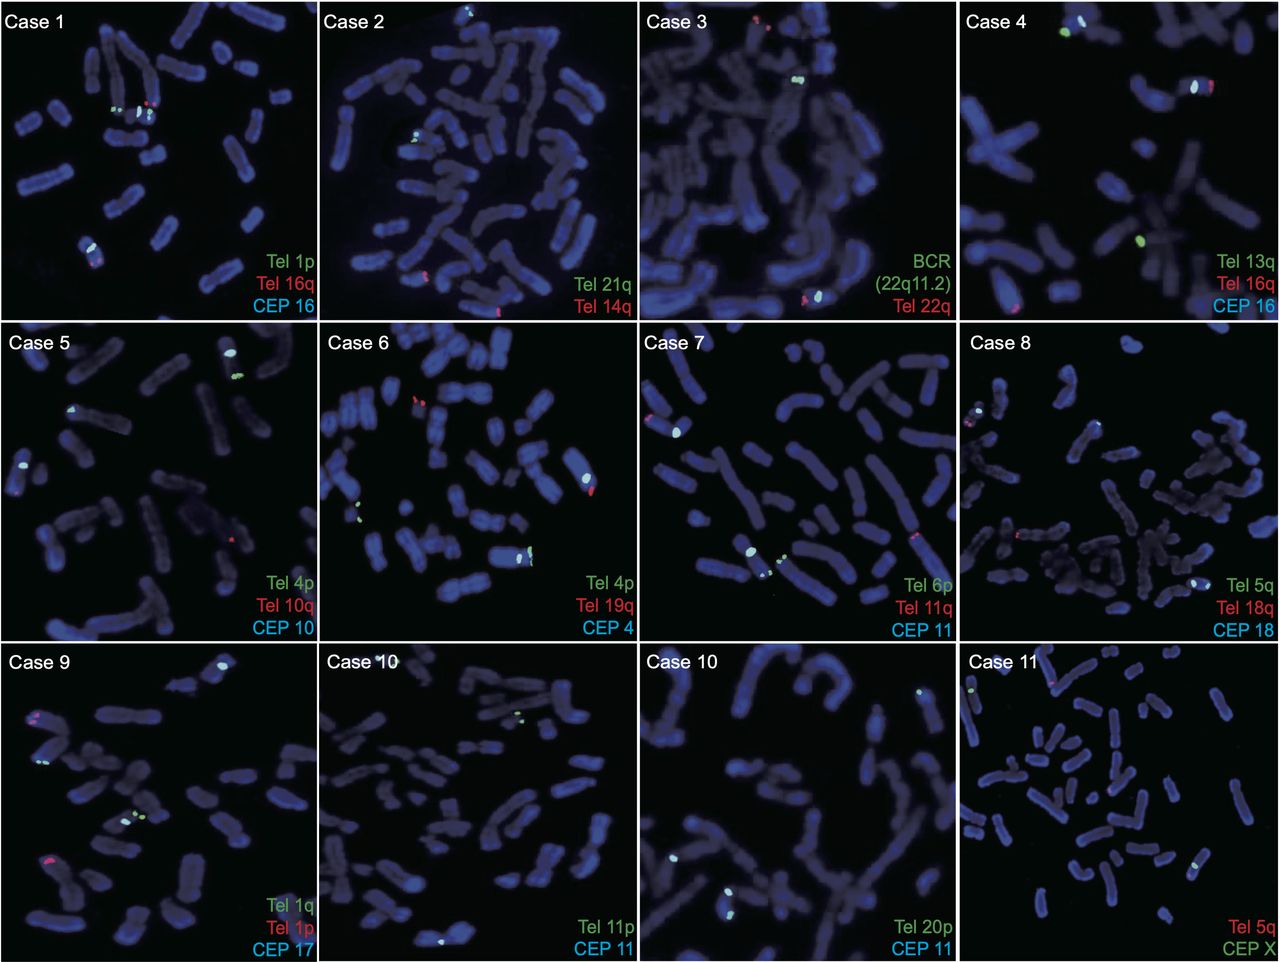
Further testing by FISH was performed to identify cryptic karyotypes following microarray-based analysis of abortions or blood samples from affected offspring. A multiplex FISH panel with specific labelled probes was developed for the present study. Figure 2 shows the FISH results of the multicolour locus-specific chromosome probes for the detection of clinically cryptic chromosomal translocations in all patients. The characteristics of FISH probes are listed in online supplemental table 1. FISH analysis of metaphase chromosomes revealed that the 300 cells from cases 1 to 10 had balanced rearrangements, whereas the 30 cells from case 11 had unbalanced chromosomal aberrations. FISH verified that two normal chromosomes and two derivative chromosomes were labelled with different combinations of probes, illustrating the presence of reciprocal translocations. For instance, in case 1, region 1p36.33–pter was translocated to 16q24.1 and region 16q24.1–qter was translocated to 1p36.33, confirming the presence of cryptic translocation. The pattern of unbalanced translocation was verified by FISH in case 11, showing a relative dosage imbalance with three normal chromosomes and only one derivative chromosome X. The adjunctive and diagnostic results of FISH confirmed the presence of cryptic translocations in all couples. The sensitivity and specificity of the OGM data were consistent with FISH.

Metaphase fluorescent FISH patterns. Illustration of the FISH results for the metaphase spreads of chromosome translocations using multicolour locus-specific probes of all recruited samples. Details of fluorescently labelled probes are listed in online supplemental table 1. CEP, centromeric probes; Tel, subtelomeric probes.
Confirmation of high-resolution OGM
To confirm the single-molecule optical mapping results, LR-PCR and PCR amplicon-based NGS were performed, followed by Sanger sequencing to accurately detect the breakpoints, down to the single-nucleotide resolution. All nucleotide sequence positions were successfully mapped onto the translocation chromosomes. An example of further confirmation of OGM analysis by LR-PCR, NGS and Sanger sequencing is presented in figure 3. The sizes of LR-PCR products were predicted to be ~5.5 kb and ~15 kb for case 3. Results of short-read sequencing showed breakpoint sites within the translocated chromosomes. The breakpoint junctions of case 3 detected by LR-PCR and NGS were located at chromosome 19 (region 56141254–56141258) and chromosome 22 (region 45393661–45393660), respectively. Sanger sequencing following NGS further verified these breakpoint sites.

An example of confirmation of optical genome mapping (OGM) data by LR-PCR, NGS and Sanger sequencing. (A) Gel electrophoresis of PCR products from the LR-PCR amplifications spanning breakpoint junctions in chromosome 19 and 22 of case 3. LR-PCR, long-range PCR; MW, molecular weight; NGS, next-generation sequencing; NC, negative control; Der, derivative chromosome. (B) Gel electrophoresis of PCR products from the PCR amplifications spanning breakpoint junctions in chromosome 19 and 22 of case 3. (C) Sanger sequencing results confirming the chromosomal balanced translocation and the precise locations of the breakpoints (arrows). The breakpoint junctions locate in chr19 56141254–56141258, chr22 45393656–45393660. (D) Visualisation of sequencing analysis of LR-PCR amplicons shows evidence of breakpoint regions. Genes ZNF444 and SMC1B were mapped within the breakpoint regions. The breakpoint junctions locate in chr19 56141254–56141258, chr22 45393661–45393660. (E) Electropherograms of the breakpoint junction sequencing showing the translocation breakpoints of case 3.
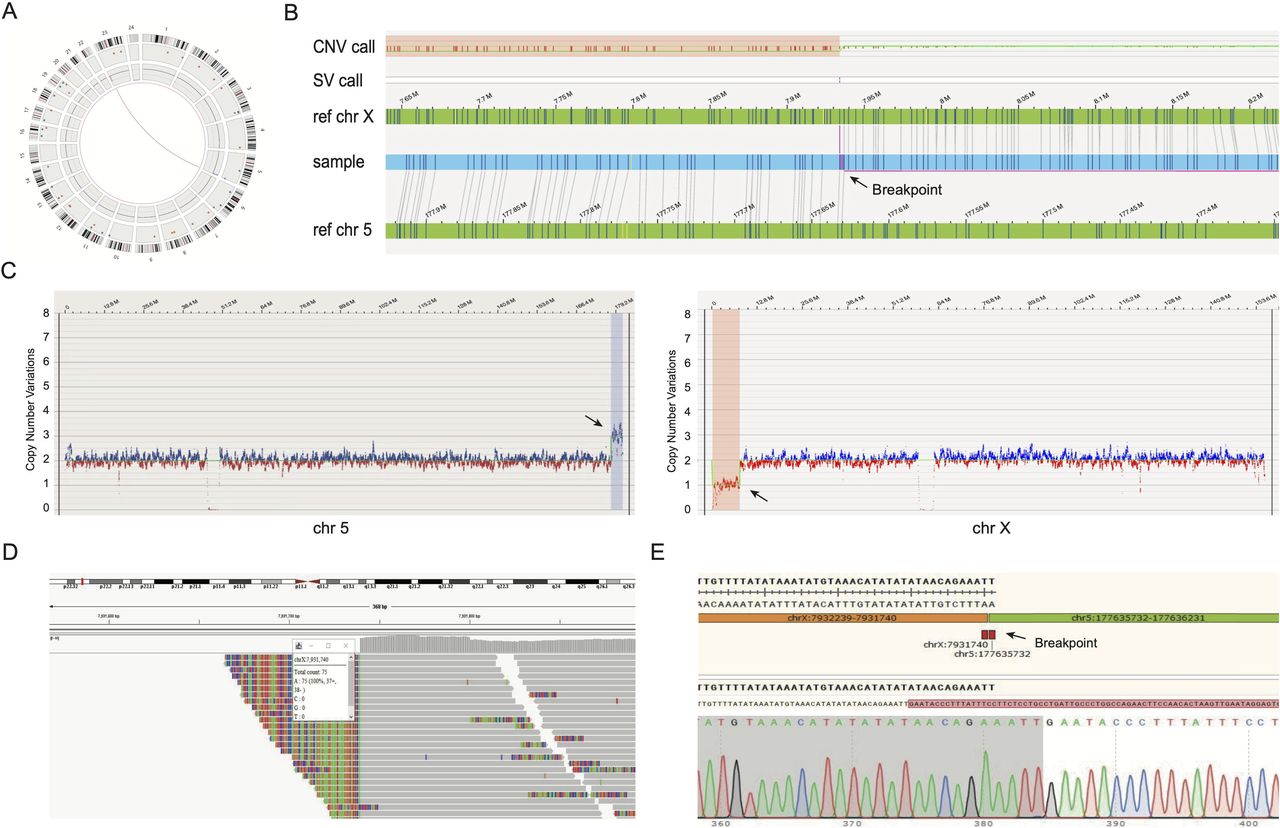
In total, 21 breakpoint-junction segments were all successfully amplified by LR-PCR. The detection capabilities of OGM compared with multiple genetic methods (CMA, PCR amplicon-based NGS and Sanger sequencing) in terms of breakpoint analysis are summarised in table 1. All clinically cryptic events were successfully detected using the OGM technology. For case 11, the infertile patient carried a cryptic unbalanced translocation. Figure 4 shows the detailed results of the cryptic unbalanced chromosomal rearrangement in case 11. The breakpoint coordinates detected by Sanger sequencing were 100% within the breakpoint regions provided by the OGM.

Example of an unbalanced translocation. Illustration of the unbalanced translocation der(X)t(X;5)(p22.31;q35.3) in sample 11. (A) Circos plot showing the rearrangement between chromosome 5 and X. The pink line in the middle of the circos plot visualises the translocation. CNV track shows gains and losses of genetic materials on chromosome 5 and X. (B) Genome map view showing the breakpoint junction (arrow) of unbalanced translocation. (C) CNV data from whole-genome optical mapping showing deletions (arrow) on chromosome 5 (left) and duplications (arrow) on chromosome X (right). (D) Integrative genomics viewe results of short-read sequencing reads showing a visualisation of breakpoints sites within the translocated chromosomes. (E) Sanger sequencing results confirming the unbalanced translocation and the location of the breakpoints (arrow).
Discussion
Human chromosomal rearrangements are diverse, frequent and often result in phenotypic abnormalities. Chromosomal rearrangements are usually defined as genomic structural alterations involving DNA segments, including balanced and unbalanced categories.5 27 Balanced genomic aberrations, such as balanced translocations and inversions, can cause abnormal phenotypes when the expression or function of critical genes is affected.28 Although most balanced rearrangements carriers show no discernible clinical phenotype, the risk of miscarriage or delivering newborns with chromosomal imbalances is increased in this population because of the unbalanced gametes generated by recombinant chromosomes during meiosis.29 30 Moreover, X-autosome translocation is related to gonadal dysfunction and premature ovarian failure when breakpoints are localised in regions of the X chromosome that are critical for ovarian functions.31 In a large study based on 163 individuals carrying de novo balanced reciprocal translocations, the risk of severe congenital abnormalities was evaluated to be 6.1%.32
Accurate determination of rearrangement breakpoints is important for revealing the genetic causes of diseases. Cryptic balanced chromosomal rearrangements are structural variants that do not dramatically alter chromosome banding or where the interchanges of genetic material are below the karyotyping limit. G-banding, the gold standard technique for detecting aneuploidy and segmental rearrangements larger than 5–10 Mb in size, is substantially restricted by cellular culture and limited resolution. FISH panels require a priori knowledge of the variants and specific probes to validate genomic aberrations. Moreover, the analytical resolution of FISH is in the range of 100–200 kb depending on the probe size, and this is a labour-intensive technique that does not come at high resolution.33 Despite the higher resolution (>100 kb) of CMA technology, it is not possible to detect copy number neutral structural rearrangements and large repetitive, unmappable structures.34 Cryptic balanced rearrangements remain undetectable by conventional clinical tests, further suggesting that they may be underestimated in the viable human germline. Therefore, a complementary diagnostic tool is necessary to detect cryptic genomic aberrations. Recently, OGM has enabled the detection of constitutional chromosomal abnormalities in the clinical diagnosis of genetic disorders. A recent study established a novel spectrum of large genomic rearrangements in prostate cancer by genome imaging.35 In another study, breakpoints of deletion, duplication and inversion were identified by means of OGM in a cohort of patients with DMD.19
The present study aimed to investigate whether OGM could be introduced as a generic diagnostic tool for detecting clinically cryptic translocations, especially for cryptic BCRs. OGM successfully detected all chromosomal translocations in recruited couples, which were confirmed using both FISH and sequence analyses. Based on the data presented here, all translocation breakpoints identified using OGM were validated by FISH in cryptic carriers (10 balanced and 1 unbalanced). Of the potentially disrupted genes (table 1), DLK1 36 has been previously associated with female infertility. CDYL 37 has been reported to be relevant in male infertility and DERL2-knockout male mice were found to be sterile.38 SMC1B 39 has been associated with meiotic maturation. OGM also identified multiple inverted translocations, in addition to cryptic translocations. Furthermore, OGM identified three high-confidence chromosomal rearrangements within highly repetitive sequences in cases 4, 5 and 11, which were difficult to detect using LR-PCR-based NGS method. Our findings showed excellent concordance of OGM with the sequencing results and further refinement of cryptic karyotypes. To the best of our knowledge, this is the first study wherein OGM facilitated the rapid and robust detection of cryptic balanced chromosomal translocations with a high resolution.
Although cryptic BCRs can be detected by FISH based on CMA results of the affected fetuses/offspring, OGM would aid in streamlining the process of detection. Accumulating evidence indicates the capacity of OGM to identify all types of chromosomal abnormalities, including aneuploidies,25 unbalanced rearrangements,40 balanced events such as inversions and translocations,41 multiple repetitive elements42 and complex chromosomal rearrangements, such as chromoanagenesis and marker chromosomes.22 Currently, sequencing techniques including both NGS-based WGS and long-read sequencing are hampered in unravelling genomic aberrations among highly repetitive sequences that are prone to rearrangements. Evidence has demonstrated that OGM is more efficient than long-read technology for characterising structural rearrangements with larger median and average sizes, as well as complex regions, such as nucleolar organiser regions and transposable elements.5 10 43 44 The main limitation of OGM currently is the missing labels in the centromeric regions, which causes some chromosomal rearrangements such as Robertsonian translocations to be missed.
OGM exhibits multiple benefits for unbiased detection of cryptic genomic abnormalities for clinical use; these include the following: (1) it enables imaging of ultra-long molecular reads (up to 2 Mb) and exhibits enhanced ability for detecting structural rearrangements that are 500 bp to several Mb in size45 46; (2) analyses based on OGM have rapid turn-around times, including both run time and data analysis time, which is of great importance with respect to the clinical testing period. The workflow of OGM per sample sum up to 3 days for machine operation (lab preparation and instrument running) and 1–2 days for automated and manual data analysis; (3) the handling of OGM highlights its strength in clinical implementation, and the OGM system has a user-friendly interface and high degree of automation with a ready-to-use software solution; (4) the capacity to uncover complex events is another core benefit. In recent studies, OGM has enabled the investigation of low-copy repeat regions in seven patients with the 22q11 deletion syndrome47 and repeat contraction/expansion diseases such as FSHD18 and myotonic dystrophy.48
Even in studies using different methodologies, there are instances in which junctions are predicted to exist but could not be identified, possibly because of these arrangements into highly convoluted structures or low-level mosaic. Currently, OGM is limited by detecting peri-centromeric balanced translocations owing to missing labels in these regions.15 49 Bioinformatics tools to identify more complex structural variants and annotate variants, such as optical mapping by multiple alignment, are still being developed.50 Of note, the resolution of OGM mainly depends on the spacing of the fluorescent labels (up to ~15 labels/100 kb) across the genome as well as the pixel resolution of the imaging machine. Currently, OGM allows the detection of insertions ≥500 bp, interstitial deletions/duplications ≥500 bp, inversions ≥30 kb and repeated contractions/expansions ≥500 bp. Ongoing efforts on developing algorithms have attempted to enable a resolution of 10 bp for OGM technology.48 A higher resolution for OGM will provide the detection of smaller structural rearrangements that usually escape detection on using classical assays, leading to the complementary use of the current methods in a clinical setting.
Conclusion
The findings presented here enhance the potential application of OGM for full-spectrum structural rearrangement detection and diagnostic yield improvement in clinical genetic testing. With the excellent performance, our research suggests that OGM can be used as a first-line method for detecting cryptic BCRs in routine clinical testing.
Data availability statement
The original contributions presented in the study are included in the article/Supplemental Materials, further inquiries can be directed to the corresponding author/s.
Ethics statements
Patient consent for publication
Ethics approval
The study was approved by the Ethics Committee of the Shanghai Ji Ai Genetics & IVF Institute, Obstetrics and Gynecology Hospital of Fudan University, Shanghai, China (JIAI202124). Written informed consent was obtained from each of the 11 couples to perform further genetic testing for the detection of chromosome translocations.
Acknowledgments
We express the deepest gratitude to all the families enrolled in our research. We would also like to thank the help of MS Zhoukai Long for single molecular optical genome mapping experiment and data analysis (genetics laboratory, Shanghai WeHealth Biomedical Technology).
References
Supplementary materials
Supplementary Data
This web only file has been produced by the BMJ Publishing Group from an electronic file supplied by the author(s) and has not been edited for content.
Supplementary Data
This web only file has been produced by the BMJ Publishing Group from an electronic file supplied by the author(s) and has not been edited for content.
Footnotes
SZ and ZP contributed equally.
Contributors CJX and SZ conceived the hypothesis and designed the study. SZ, CL and XS collected the cases. SZ, ZP, SJZ, JZ, and JY performed experiment and data analysis. SZ and ZP wrote the manuscript. CJX, CMX, DL and KD revised the manuscript and provided edits. All authors contributed to the final manuscript and approved the submitted version.
Funding The research was supported by Shanghai Science and Technology Innovation Action Plan Program (18411953800, 20Y11907200), Shanghai 'Rising Stars of Medical Talents' Youth Development Program and Natural Science Foundation of Chongqing (grants cstc2020jcyj-zdxmX0011 and cstc2020jcyj-msxmX0012).
Competing interests None declared.
Provenance and peer review Not commissioned; externally peer reviewed.
Supplemental material This content has been supplied by the author(s). It has not been vetted by BMJ Publishing Group Limited (BMJ) and may not have been peer-reviewed. Any opinions or recommendations discussed are solely those of the author(s) and are not endorsed by BMJ. BMJ disclaims all liability and responsibility arising from any reliance placed on the content. Where the content includes any translated material, BMJ does not warrant the accuracy and reliability of the translations (including but not limited to local regulations, clinical guidelines, terminology, drug names and drug dosages), and is not responsible for any error and/or omissions arising from translation and adaptation or otherwise.