Article Text

Abstract
Question What (risk) factors are associated with plantar fasciopathy (PF)?
Design Systematic review with meta-analyses.
Participants Patients with PF.
Factors All factors described in prospective, case–control or cross-sectional observational studies.
Results 51 included studies (1 prospective, 46 case–control and 4 cross-sectional studies) evaluated a total of 104 variables. Pooling was possible for 12 variables. Higher body mass index (BMI) (BMI>27, OR 3.7 (95% CI 2.93 to 5.62)) in patients with PF was the only significant clinical association, and its effect was the strongest in the non-athletic subgroup. In people with PF compared to controls, pooled imaging data demonstrated a significantly thicker, hypoechogenic plantar fascia with increased vascular signal and perifascial fluid collection. In addition, people with PF were more likely to have a thicker loaded and unloaded heel fat pat, and bone findings, including a subcalcaneal spur and increased Tc-99 uptake. No significant difference was found in the extension of the first metatarsophalangeal joint.
Conclusions We found a consistent clinical association between higher BMI and plantar fasciopathy. This association may differ between athletic and non-athletic subgroups. While consistent evidence supports a range of bone and soft tissue abnormalities, there is lack of evidence for the dogma of clinical and mechanical measures of foot and ankle function. Clinicians can use this information in shared decision-making.
- Foot
- Review
- Epidemiology
Statistics from Altmetric.com
Introduction
Plantar fasciopathy (PF) is the most common cause of inferior heel pain.1 ,2 Pain on the underside of the heel affects 10% of adults in their lifetime, accounting for one million patient visits per year to doctors in the USA.3–5 The condition is common across community, athletic, occupational and military settings,6–8 and is one of the most frequently cited running injuries, with an incidence rate of 31% over 5 years.9
PF is a clinical diagnosis described by pain or localised tenderness at the insertion of the plantar fascia on the calcaneus, which becomes worse on bearing weight in the morning or after periods of inactivity or with prolonged walking.10 ,11 The terminology used to describe PF is inconsistent. Synonyms include plantar heel pain, heel spur syndrome and plantar fasciitis. We refer to the diagnosis as PF.12
Multiple treatment options are available for PF, although effectiveness is generally reported as low to moderate.2 ,3 ,13–18 Lack of consensus on management strategies may arise from the limited understanding of the aetiology of PF. Narrative reviews that summarise the available evidence on the aetiology of PF are largely based on clinical experience and few were designed systematically.2 ,13 ,15–17 ,19 Two high-quality reviews of case–control and case-series reported that plantar fascia thickness (PFT), the presence of a heel spur and a higher body mass index (BMI) were associated with PF.20 ,21 Whether these are causes or consequences of PF is a key question and we address it in the discussion of this paper. There has been no comprehensive systematic review of all factors, including prospective and retrospective evidence, associated with PF. Therefore, we systematically reviewed all factors associated with PF, as described in prospective, case–control and cross-sectional studies.
Methods
Criteria for considering studies in this review
Type of studies
Prospective studies, case–control studies and cross-sectional studies—written in English, German or Dutch—examining factors associated with PF were eligible (box 1). Given that case–control and cross-sectional studies provide no information regarding causality, these were analysed separately from the prospective study which can identify a candidate who may be causally associated with PF.
Inclusion criteria
Design
Prospective study, case–control study, cross-sectional study
Language
English, German, Dutch
Terminology
All synonyms for plantar fasciopathy
Participants—cases
Adolescents, adults
Tenderness or pain at rest, during exercise or palpation in
The inferior heel
The insertion of the plantar fascia on the calcaneus
Heel pain for more than 1 month consistent with a history of plantar fasciopathy, or moderate or severe foot pain lasting more than 1 week or at least three times/year
Clinical evidence of plantar fasciopathy: pain provoked when taking the first few steps in the morning or after a period of rest; increased pain at the commencement of weight bearing
Participants—controls
Healthy control group
Outcome measures
At least one possible risk factor or variable
Comparison
Plantar fasciopathy versus control
Type of participants
Adolescents and adults suffering from acute or chronic symptoms of PF were included. There were no limitations regarding age, gender and setting. Because of inconsistency in terminology for PF, studies were included based on the description of included patients. Studies were only included if they described patients with one or more of the following criteria:
Tenderness or pain at rest, during exercise or palpation in
Inferior heel
Insertion of the plantar fascia on the calcaneus
Heel pain >1 month consistent with a history of PF, or moderate or severe foot pain >1 week or >3 times/year
Clinical evidence of PF
Pain provoked taking the first steps in the morning or after a period of rest
Increased pain at the start of weight bearing (WB).
Studies including participants with heel pain in areas other than the plantar aspect of the heel, studies focusing on other foot pathologies or describing participants with systemic diseases were excluded. Studies had to report findings in a healthy control group in order to be included.
Type of measurements
Only studies including and describing at least one possible factor or variable associated with PF were included in this review. Data had to be reported on both patients and healthy control participants.
Search for relevant studies
The primary search was conducted in PubMed (MEDLINE), EMBASE, Web of Science (WoS), MEDLINE (OVID) and the Cochrane Central Register up to 4 of June 2014 (see online supplementary file 1).
Data collection and analysis
From titles and abstracts, two reviewers (KDBvL, MvM) assessed the results of the literature search according to predetermined selection criteria to identify potentially relevant studies for full-text review. Full text was obtained if the abstract seemed to fulfil the inclusion criteria or if eligibility was unclear. All full-text articles were further screened on inclusion criteria by the two independent authors.
Methodological quality
A quality assessment list was created based on criteria from the Dutch Cochrane Centre,22 van Rijn et al23 and Lankhorst et al24 (table 1). Two reviewers (KDBvL, JR) independently rated the quality of the studies by scoring each of the nine criteria as ‘positive’, ‘negative’ or ‘unclear’. Differences in assessment were discussed to reach consensus. The quality score of each study was calculated as the percentage of the positive scored items divided by the maximum score possible.
Quality assessment list; criteria for quality score (positive, negative or unclear)
Data extraction
Two review authors (KDBvL, JR) extracted relevant data from the studies. The following data were noted in a standardised form: (1) study characteristics: design, number of participants, gender, age, BMI, setting, duration of symptoms and definition for PF; (2) characteristics of the factors studied: variables, instruments and scores (eg, mean, median, OR, SD, and 95%CI).
Data analysis and statistical analysis
Comparison variables were combined into main clusters of factors potentially associated with PF. For all studies that supplied adequate data, mean differences (MD) for continuous data and OR for dichotomous data with matching 95% CI were calculated. Numbers were estimated when studies reported data only as graphs.
Where data were not reported, corresponding authors were contacted and asked to provide original data. If this could not be obtained, data were not included in the meta-analysis but were included in the narrative synthesis. If studies did not provide sufficient information to calculate the 95% CI, information on differences between cases and controls (with p value) were extracted.
We do not report on associations between PF and age and sex as around 50% of studies definitely matched on these variables, and the description of sampling on these variables was often unclear in the other studies.
Meta-analyses were performed using Review Manager 5.2, using random-effects models. The event was defined as the number of participants affected with PF. All MDs and ORs were calculated from cases to controls. Heterogeneity was assessed using the Q-test and I.2 We assessed publication bias by visual inspection of funnel plots.
Review protocol
The review protocol was written a priori, but not published or registered in PROSPERO or a similar database.
Results
Characteristics of the included studies
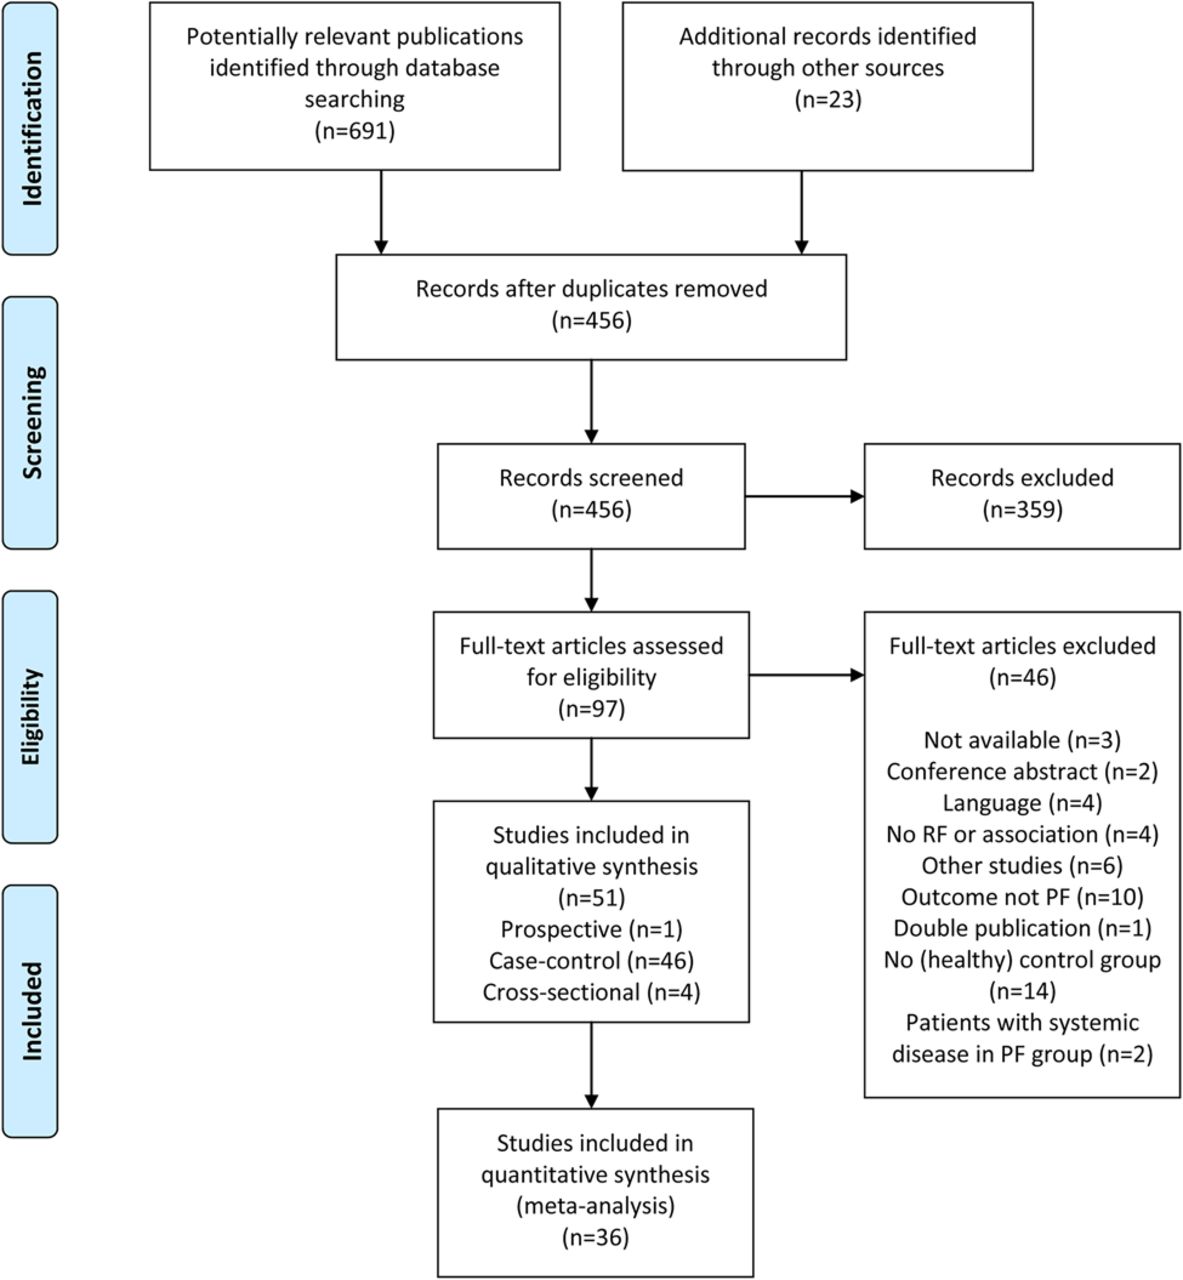
A total of 51 studies met the inclusion criteria and are included in this review, including 1 prospective cohort study, 46 case–control studies and 4 cross-sectional studies (figure 1 and online supplementary file 2).25 The number of patients included in the studies ranged from 6 to 190, with a total of 2105 patients with PF.

Flow chart of study inclusion (PF, plantar fasciopathy).
Methodological quality
The two raters initially agreed on 85% of the items among the 51 included studies (table 2). The quality score ranged from 11% to 100% and the mean quality score was 58%. Two articles scored 100%4 ,26 and three articles scored 11%.27–29 Only 18 studies scored positive on item 1 ‘study groups are clearly defined’,4 ,8 ,26 ,30–44 and only 15 studies scored positive on item 3 ‘50 cases or more’.4 ,9 ,26 ,31 ,36 ,39 ,45–53
Quality assessment of included studies (n=51)
Risk factors for PF
There was just one prospective cohort study— undertaken over 5 years—which identified an incidence rate of 31.3% in 166 running athletes.9 Six variables were significantly associated with a higher risk of PF: varus knee alignment (OR 5.63 (95% CI 2.01 to 15.72)), use of spiked athletic shoes (OR 5.49 (95% CI 1.71 to 17.64)), cavus arch posture (OR 5.52 (95% CI 2.12 to 14.33)), greater number of days of practice per week (OR 2.59 (95% CI 1.68 to 3.99)), greater number of years of activity (MD 3.30 (1.01 to 5.59)), and running more kilometres per week (MD 20.00 (12.12 to 27.88)).9 This prospective study used no imaging measures; so all the imaging data reported below comes from case–control and cross-sectional studies.
Factors associated with PF
Clinical factors
Body mass index
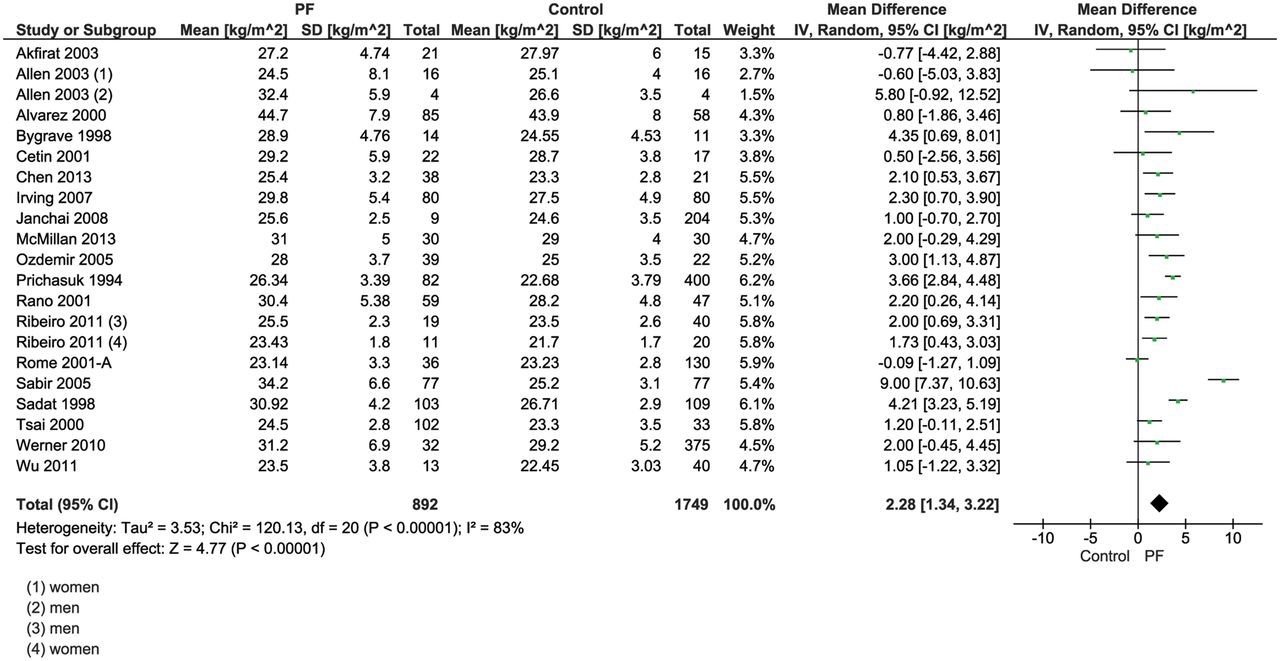
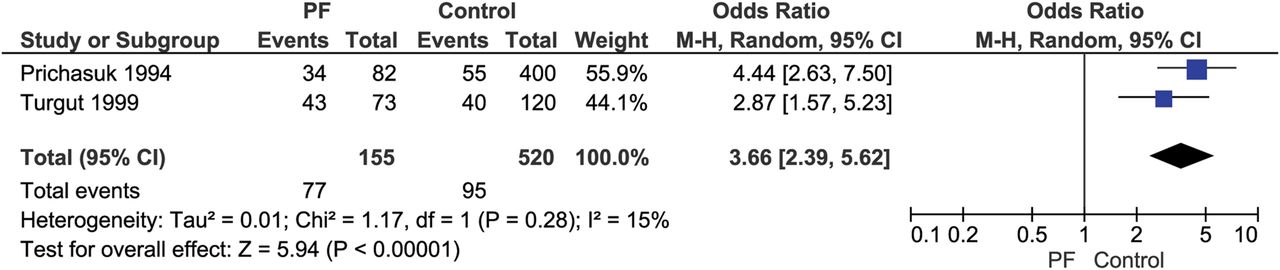
BMI was reported in 28 studies, with 7 excluded from analysis for applying matching for BMI (see online supplementary file 3). Of the remaining 21 studies, BMI was measured as a continuous variable in 19 studies and as dichotomous variable in 2 studies.4 ,52 A significantly higher BMI was found in the PF group compared to the control group (pooled MD 2.3 kg/m2 (95% CI 1.3 to 3.2)) (figure 2). For the pooled dichotomous data, a positive association between PF and overweight (BMI >27) was found (OR 3.7 (95% CI 2.9 to 5.6), figure 3);48 ,52 two remaining studies found a positive association between PF and obesity (BMI >30)4 ,26 while in the same study no significant association was found for overweight status (BMI 25–30).4 No significant association was found in self-reported weight gain between patients with PF and control participants.36

Forest plot on association plantar fasciopathy and body mass index (continuously measured).

Forest plot on association plantar fasciopathy and body mass index >27 kg/m2.
Muscle strength
Three studies examined differences in muscle strength between PF and controls.26 ,30 ,54 Plantar flexion peak torque measured with isokinetic dynamometry was significantly less at speeds of both 60° and 180°/s in PF cases compared to control participants.54 Calf muscle endurance was significantly greater in the PF group compared to controls.26 A significantly lower toe flexor muscle strength was also found in the symptomatic feet of people with PF compared to control participants.30
Flexibility
Hamstring muscle flexibility
Three studies examined muscle flexibility of the hamstrings.28 ,45 ,55 Two studies reported a significant contracture of the hamstrings muscles in patients with PF compared to controls,45 ,55 and people with PF had a smaller straight leg elevation than control participants;45 both measures indicate less flexibility in the hamstring muscles of patients with PF.
Flexibility of the ankle
Differences in flexibility of the ankle joint between patients with PF and controls were examined in six studies.4 ,26 ,28 ,38 ,45 ,54 Two studies reported significantly lower non-weight bearing (NWB) passive ankle dorsal flexion (DF) range of motion (ROM).4 ,45 Two studies assessing athletes found no significant difference in DF ROM when compared to controls, although Messier and Pittala28 reported a significant increase in total sagittal ROM in cases (MD 7.09° (95% CI 5.88 to 8.30)).38 In a community sample, Irving et al26 reported greater ankle mobility (MD 4.6° (95% CI 2.48 to 6.72)), which was not significant after multivariate analysis. A sixth study presented case-–ontrol data from a young (mean age 31) athletic population demonstrating significantly lower ankle dorsiflexion (see online supplementary file 2).54
Flexibility of the first metatarsophalangeal joint
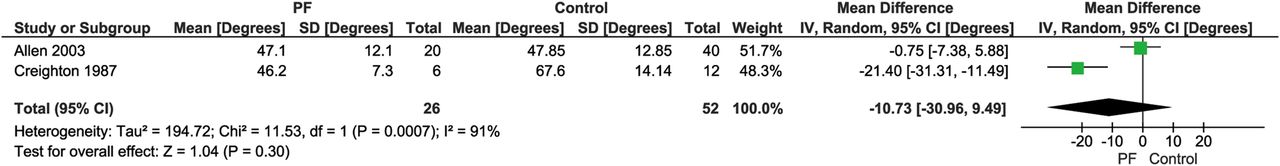
Three studies reported on the ROM of the first metatarsophalangeal (MTP) joint.30 ,42 ,56 Pooling was possible for two studies reporting on NWB passive extension of the first MTP and no significant difference was found between the groups (MD −10.73 (95% CI −30.96 to 9.49), figure 4).30 ,56 However, a significantly smaller ROM in the PF group was reported in a single study for active extension, passive flexion and active flexion (see online supplementary file 3).56 Furthermore, MTP mobility assessed dynamically during gait with video fluoroscopy was found to be lower in extension in PF cases.42

Forest plot on association plantar fasciopathy and passive extension of the first metatarsophalangeal joint (degrees).
Posture and alignment
Measurements of static foot posture and lower limb alignment were reported in 11 studies.8 ,26 ,28 ,30 ,31 ,37 ,38 ,40 ,48 ,57 ,58 Significant findings for foot posture in non-athletic groups include a more pronated foot posture (Foot Posture Index, MD 1.3 (95% CI 0.42 to 2.18)), a lower sagittal plane calcaneal pitch on X-ray (MD −4.55° (95% CI −5.62 to −3.48)) and reduced sagittal arch angle change between NWB and WB (indicating greater arch stiffness) on X-ray.26 ,48 ,58 No significant associations were found for other types of measurements regarding foot posture.8 ,28 ,30 ,31 ,37 ,38 ,40 ,57 Static measures of leg alignment beyond the significant findings of Di Caprio yielded non-significant associations with a measure of ‘Q angle’ and lower limb length discrepancy.28
Dynamics
Three studies examining eight variables reported on kinematic factors.8 ,28 ,42 Messier and Pittala28 reported significant findings in an athletic population for maximum pronation ROM (°), maximum pronation velocity (°/s), time to maximum pronation (ms) and total rear foot movement (°) while running at their ‘average training pace’. Under video fluoroscopy for overground walking, no significant difference in stance phase duration, maximum arch angle or change in arch angle from heel strike to mid-stance was recorded between participants with and without PF.42 ‘Abnormal forefoot pronation’ assessed visually in gait was found to be significantly associated with PF in an occupational setting.8
Kinetic factors
Four studies examined kinetic factors describing seven variables.6 ,8 ,40 ,41 The energy dissipation properties of the plantar fat pad and maximum heel pad stiffness (N/mm) were lower in PF, whereas peak stress, peak strain and the stress-strain ratio at the point of peak stress were not associated with the presence of PF.6 ,41 Werner et al8 reported a significantly higher metatarsal pressure (lbs/inch2) in pressure mat gait assessments. Other pressure mat assessments showed no significant differences.40
Imaging factors
Plantar fascia
Twenty-four studies described characteristics of the plantar fascia with pooling possible for five variables. Twenty-one studies described the association between PFT and PF,27 ,29 ,32 ,34 ,39 ,40 ,43 ,44 ,47 ,49 ,53 ,59–68 nine of which applied matching for possible confounding factors such as age, gender and body weight (see online supplementary file 2).34 ,40 ,44 ,47 ,49 ,60 ,62 ,63 ,66
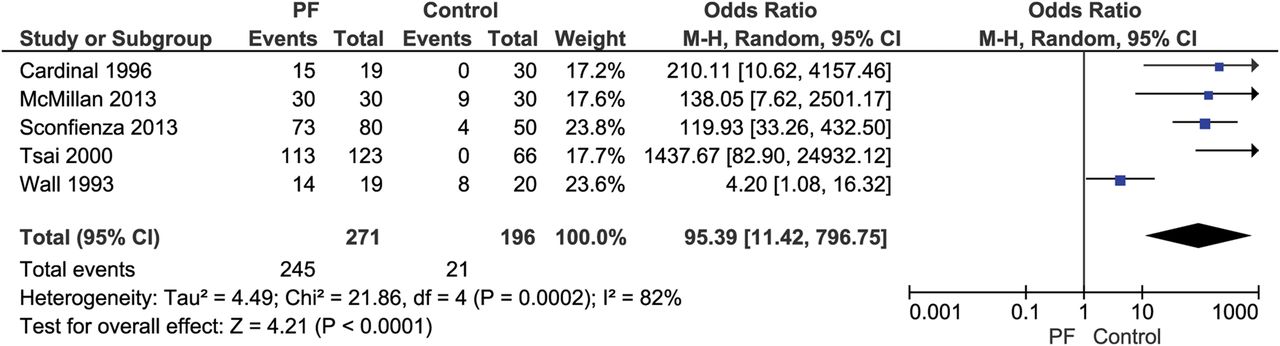
PFT was measured using MRI, ultrasound (US) and X-ray. Pooled data for all imaging techniques from 19 studies showed that people with PF had an average 2.32 mm (95% CI 1.86 to 2.79) thicker plantar fascia compared to control participants (MD of (figure 5).27 ,29 ,32 ,34 ,39 ,40 ,43 ,44 ,49 ,59–68 Subgroup analyses for the separate imaging techniques showed a MD of 2.20 (95% CI 1.68 to 2.72) for US, 3.36 (95% CI 1.81 to 4.90) for MRI and 2.40 (95% CI 1.88 to 2.92) for X-ray. Similar trends were seen in the two studies in which pooling was not possible.47 ,53 Five studies applied a dichotomous cut-off value (4 and 4.5 mm) for the PFT.39 ,44 ,61 ,66 ,51 Pooling of these results produced an OR of 95 (95% CI 11 to 797) in favour of the PF group (figure 6).39 ,44 ,51 ,61 ,66

Forest plot on association plantar fasciopathy and plantar fascia thickness (in mm, all imaging techniques).

Forest plot on association plantar fasciopathy and plantar fascia thicker than 4 mm (dichotomous).
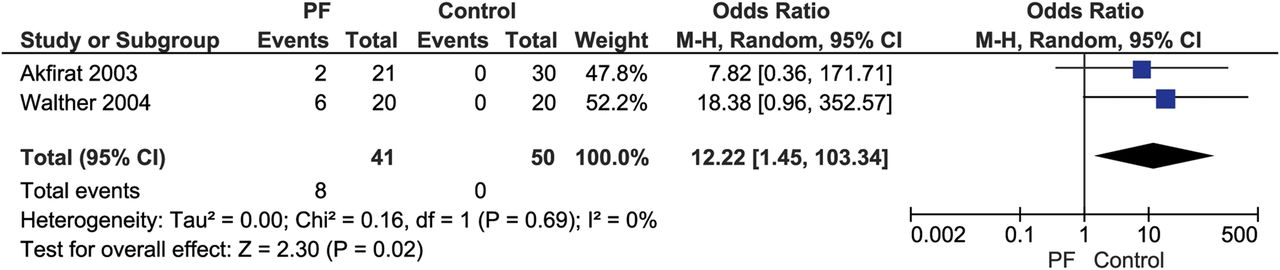
Six studies described the association between hypoechogenicity—qualitative changes in the echogenicity of the plantar fascia on US examination—and PF.34 ,39 ,47 ,51 ,61 ,67 Hypoechogenicity was significantly more frequent in people with PF than healthy controls (OR 150 (95% CI 38 to 593), figure 7). In addition, pooled data of two studies showed a significantly larger number of patients with perifascial fluid collection compared to control participants (OR 12.2 (95% CI 1.5 to 103), figure 8).59 ,67

Forest plot on association plantar fasciopathy and hypoechogenicity of plantar fascia.

Forest plot on association plantar fasciopathy and perifascial fluid collection.
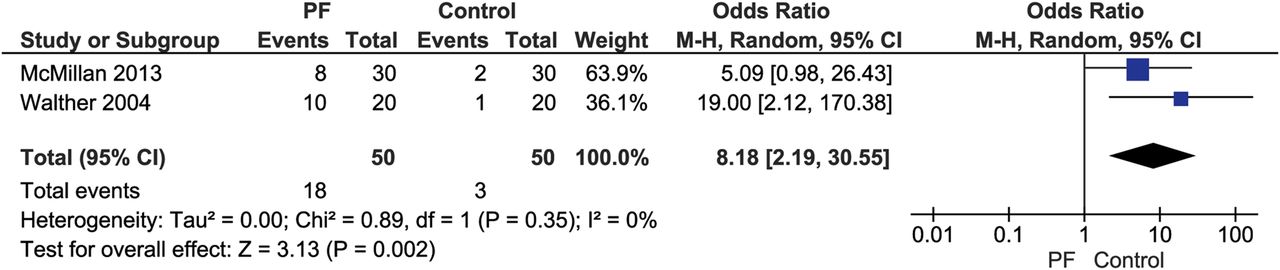
Three studies described vascular signal within the plantar fascia.43 ,44 ,67 Pooling was possible for the presence of hyperaemia, the radiologists subjective opinion of greater than normal blood flow through the plantar fascia, in people with PF and controls. An OR of 8.2 (95% CI 2.2 to 30.6) was found in favour of the PF group (figure 9).44 ,67 The third study measured a vascularity index, a quantitative measurement of plantar fascial blood flow, and similarly found a small but statistically significant increase in vascular signal in people with PF compared to controls.43

Forest plot on association plantar fasciopathy and hyperaemia of the plantar fascia.
Six studies described eight other characteristics of the plantar fascia.41 ,51 ,58 ,59 ,67 ,68 One study found a positive association between a shorter plantar fascia and a reduced length and PF.58 One study reported a greater maximum PFT within 3 cm from the calcaneus in people with PF compared to controls.32 One study reported significantly more people with PF with blurring of the superficial and deep borders of the plantar fascia than controls.51 One study found an association between increased biconvexity and PF.59
Two studies undertook sonoelastographic assessment of the plantar fascia and identified a softer PF and less elastic plantar fascia in PF participants compared to controls (p<0.001).51 ,68 No significant associations were found among the other studied variables.41 ,59
Heel pad
Nine studies described characteristics of the heel fat pad 0.6 ,27 ,31 ,32 ,39 ,49 ,60 ,64 ,69 Pooling was possible for loaded and unloaded heel pad thickness measured by either MRI or US. In pooled data, both unloaded and loaded heel pad thickness was significantly greater in patients with PF compared to controls (5 studies, MD 0.81 mm (95% CI 0.11 to 1.51) (figure 10) and two studies, MD 1.05 mm (95% CI 0.26 to 1.84) (figure 11) for unloaded and loaded heel pad thickness, respectively).27 ,31 ,32 ,39 ,49 ,69

Forest plot on association plantar fasciopathy and unloaded heel pad thickness (mm).

Forest plot on association plantar fasciopathy and loaded heel pad thickness (mm).
Two studies described the compressibility of the heel pad using radiography and US. One study examined the difference in heel fat pad thickness between an unloaded and body weight loaded state, and demonstrated greater compressibility in people with PF than controls (MD 0.70 mm (95% CI 0.16 to 1.24)) while the other study found no significant difference between the groups.31 ,32 In addition, unclear demarcation of the triangular fat pad deep to the plantar fascia origin was more frequently seen in people with PF.64 No association was found between the presence of subcutaneous fibrous septa and PF.60
Calcaneus
The presence of a calcaneal spur (CS) was examined in 11 studies.31 ,33 ,47 ,48 ,52 ,59 ,60 ,64 ,70–72 Six studies matched for age and gender.47 ,52 ,60 ,70–72 Pooling showed that CS were significantly more common in patients with PF than controls (OR 8.21 (95% CI 4.32 to 15.62), figure 12).

Forest plot on association plantar fasciopathy and presence of a calcaneal spur.
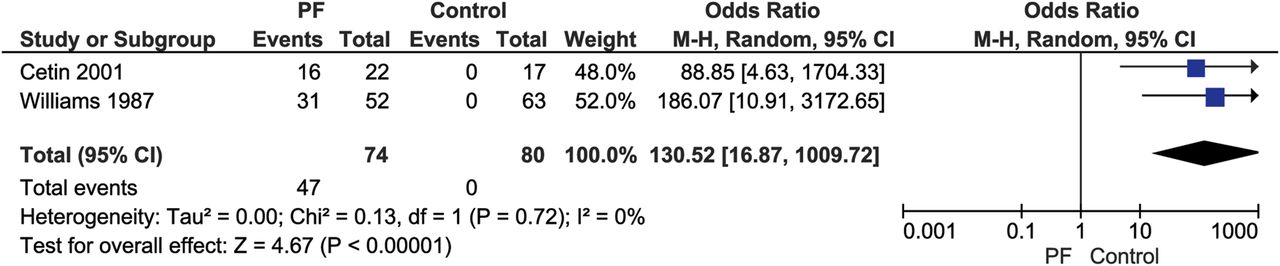
Two studies examined Tc-99 uptake in the subcalcaneal region, indicating metabolic bone activity;33 ,72 higher uptake of Tc-99 was significantly more common in patients with PF compared to controls (OR 130.52 (95% CI 16.87 to 1009.72), figure 13). In one study, a positive association between cortical irregularity at the plantar fascia origin and PF (OR 7.22 (95% CI 2.59 to 20.14)) was found. One study found an increased spur length and spur grade in people with PF compared to control participants (MD 1.51 and 0.63, respectively).70 No significant associations were found among the other studied variables.47 ,64

Forest plot on association plantar fasciopathy and increased uptake of Tc-99 in the subcalcaneal region.
Plantar nerve
One age-matched and BMI-matched study reported a strong association between PF and abnormal values in nerve conduction velocity of the medial and lateral plantar nerves (OR 263.57 (95% CI 12.82 to 5417)).35 Abductor digiti minimi atrophy on MRI, a late-stage marker of lateral plantar nerve injury (‘Baxter’s neuropathy’), was also associated with a diagnosis of PF (OR 3.35 (95% CI 1.31 to 8.56)).46
Other factors
Activity level
Four studies reported on standing time.4 ,8 ,31 ,33 People with increased occupational standing time on hard surfaces (OR 1.3 (95% CI 1.1 to 1.6)) and those who spent the majority of their workday on their feet were more likely to have PF (OR 3.6 (95% CI 1.3 to 10.1)).4 ,8 No association was found with daily standing time or having a standing job.31 ,33
Five other occupational-related variables were examined in two studies.8 ,26 The percentage time spent walking at work, the number of truck entrance/exits and a moderate tenure (11–20 years) were significantly associated with PF.8 ,26
An analysis of physical activity in two studies including recreational and competitive athletic activity yielded mixed findings.4 ,36 Undertaking no regular exercise was associated with an increased prevalence (OR 3.64 (95% CI 1.62 to 8.19) while physical activity three times a week for more than 20 min was associated with decreased prevalence of PF (OR 0.33 (95% CI 0.14 to 0.74)).4 ,36 Self-reporting as a recreational jogger was not associated with PF.
Footwear
In an occupational setting, more frequent shoe rotation was negatively associated with PF (OR 0.3 (95% CI 0.1 to 0.7)).8 No association was found with flat shoe use and PF.31
Sensitivity and subgroup analyses and publication bias
There was substantial heterogeneity in pooled analyses for PFT, plantar fascia hypoechogenicity, unloaded heel pad thickness, presence of CS, BMI and passive extension of the first MTP joint (figures 2, 4, 7, 9, 11 and 13, respectively).
A significant interaction was noted for the presence of a CS and age, with a larger effect size for older (>50 years, OR 23.47 (95% CI 9.45 to 58.30)) compared to younger participants (<50 years, OR 5.78 (95% CI 2.51 to 13.31)), (p=0.03). PFT by US yielded significantly different effect sizes for subgroups based on the unit of analysis; by heels (MD 1.80 (95% CI 1.08 to 2.52)) and participant (2.63 (95% CI 2.40 to 2.85)), (p=0.03). The overall effect size for PFT meta-analysis was unchanged when a sensitivity analysis was performed assessing the potential impact of clustering, that is, testing the assumption that use of two feet from the same participant was more (intraclass correlation coefficient, ICC=0.8) or less (ICC=0.5) related. The funnel plots for BMI and PFT but not CS are suggestive of publication bias (see online supplementary file 4). However, effect sizes using random-effect and fixed effects models for BMI, PFT and CS are similar.
Discussion
Summary of findings
This review presents a comprehensive appraisal of the evidence for clinical and imaging factors in PF. From 51 papers, 12 variables were considered sufficiently comparable to group for meta-analysis. Consistent poolable imaging findings included a thickened, hypoechoic plantar fascia and the presence of a subcalcaneal spur.
The strongest clinical association was for BMI and there was some consistency for reduced hamstring flexibility, but overall, the evidence supporting associations for ankle and first MTP ROM, muscle strength, kinematic and kinetic factors, foot posture and physical activity levels was either inconsistent or inconclusive.
Weight status and patient subgroups
The presence of subgroups within the spectrum of PF might partly explain the findings of this review. One subgroup could relate to symptom duration. Increased vascular signal, sometimes referred to as hyperaemia, is an established finding in tendinopathy.73 It would appear that PF has similar presentation to other tendinopathies; however, we were unable to explore this further with subgrouping based on disease duration.
The association with BMI appears consistent for participants in a non-athletic setting. The association between BMI and musculoskeletal symptoms is widely recognised.74 Increased mechanical load due to higher BMI is a plausible source of increased plantar fascial stress. However, both incident and prevalent foot pain is more strongly associated with fat mass rather than fat free mass, and therefore adiposity related inflammatory mechanisms might play a role.74 ,75 The lack of association of BMI in the only prospective study testing an athletic cohort challenges the notion a high BMI applies to all PF populations and indicates that athletic populations may represent a distinct subgroup of people with PF.9 While raw BMI data were not provided for PF cases in the study of Di Caprio et al,9 which precluded analysis of the role of BMI, the relatively low mean BMI of <20.6 kg/m2 in 55% of all included participants might indicate that BMI may be a less important variable in athletic populations. The lack of other clinical associations does not mean that they do not play a role in the disease pathway, that is, this might be caused by a lack of power. Thus, while we report on many associations, where these sit in the aetiological and disease pathway is often unclear.
There appears to be two distinct populations affected by PF—athletes and more sedentary individuals with a relatively high BMI. The association with BMI, although based on a single study, seems less evident in athletic populations compared to populations with a higher BMI. Loading of the plantar fascia has proved a difficult factor to capture in the studies under investigation and therefore, not reported on. However, loading might play a role in both proposed distinct patient populations: both athletes and sedentary populations with a high BMI might exceed a threshold of loading, though caused by different mechanisms. However, both the inflammatory mechanisms as well as mechanical mechanisms are likely to play a role in the disease pathway in both proposed distinct populations exercise-loading strategies.12 ,76
Imaging
The association between a thickened, hypoechoic plantar fascia and PF is well established. Histopathological changes in the plantar fascia taken from surgical biopsy confirm a range of degenerative processes resulting in collagen breakdown, fibrocyte cell population changes (including death), matrix degradation and vascular ingrowth, and these appear to represent a similar process observed in the tendinopathy continuum.5 ,77 ,78 It is likely that these processes, along with more acute fluid shift events, explain these imaging findings. The average thickness of the asymptomatic plantar fascia has been documented at 3.5 mm and in this context, the identified effect size of 2.31 mm in this review is likely to be clinically relevant (ie, 66% increase).79 However, as PFT can also vary with BMI and is a target in metabolic diseases, such as diabetes mellitus, such diagnostic cut-off points should be viewed with caution, and comparison should at least be made between affected and non-affected sides.80 ,81 However, as US is a sensitive test to assess PF morphology, the absence of thickening should certainly raise the possibility of there being alternative sources of pain.
Despite the debate about the role of heel spurs in PF, the presence of a CS is strongly associated with PF both in our own and in a previous review.21 The role of CS in relation to the pathological process of PF is questioned, since these have relatively high prevalence in the general population, and increasing age, osteoarthritis and obesity are associated with enthesophyte formation.82 ,83 The causal role of the CS in generating a pain state is not clear although sensitive neurovascular structures pass between this and the potentially similarly enlarged plantar fascia, creating a space occupying (Baxter’s) lesion.46
Strengths and limitations
Visual inspection of funnel plots for the outcomes of PFT, CS and BMI suggests there is potential for publication bias; however, sensitivity analyses comparing random-effect and fixed effects models suggest that the results were not unduly influenced by small study effects.
The quality of included studies varied widely (11–100%), and no less weight was given to studies with a high risk of bias. Whether measures were assessed in a blinded fashion was not assessed in our quality score so we cannot assess whether selection or observer bias influenced the results. Sensitivity analyses where meta-analyses were repeated in the above and below median quality scores showed that study quality did not materially affect effect sizes or our conclusions.
Statistical heterogeneity was seen in some pooled results which might partly be explained by differences in design and participants, including setting, age, gender, BMI and activity levels. However, the number of studies allowed only limited exploration of heterogeneity. Of the variables examined, only the unit of analysis explained any meaningful degree of heterogeneity. Inclusion criteria were all based on a clinical definition of PF. It is possible that some cases had heel pain from causes other than the plantar fascia, which might reduce the apparent effect sizes for some factors.
Finally, with just a single prospective study included in this report, most factors identified are based on cross-sectional and case–control observations and preclude a statement regarding cause or effect.
What are the findings?
Body mass index was consistently associated with plantar fasciopathy, though the mechanism for this remains uncertain, and may differ in athletic versus non-athletic study populations.
In addition to the known associations with increased plantar fascia thickness, hypoechogenicity and subcalcaneal spurs, we found evidence for an association between the presence of PF and increased vascular signal within the plantar fascia and to a lesser extent, markers of nerve injury.
We examined a wide range of potential clinical measures, though there is insufficient data to yet judge which of these are likely to be aetiological or of clinical importance.
How might it impact on clinical practice in the future?
Weight loss might play a role in future plantar fasciopathy treatment, though feasibility and effectiveness should be investigated in future studies.
References
Supplementary materials
Supplementary Data
This web only file has been produced by the BMJ Publishing Group from an electronic file supplied by the author(s) and has not been edited for content.
- Data supplement 1 - Online Search_strategy
- Data supplement 2 - Online Study_characteristics
- Data supplement 3 - Online Data_extraction
- Data supplement 4 - Online Funnelplots
Footnotes
Correction notice This paper has been amended since it was published Online First. The figures 2 to 9 were in the wrong order and this has now been corrected.
Contributors All four authors collaborated to provide the concept and focus for this review, have approved the manuscript, and agreed to be accountable for all aspects of the work. KDBvL, JR, TW and MvM designed the protocol and the search strategy which was executed by KDBvL. KDBvL and JR screened the initial results and extracted data from the primary studies. KDBvL drafted the original manuscript which was then critically revised by MvM, JR and TW.
Funding Dutch Arthritis Foundation
Competing interests None declared.
Provenance and peer review Not commissioned; externally peer reviewed.