Article Text

Abstract
Objectives To understand the discrepancy between the published 10-year cardiovascular risk and 10-year cardiovascular risk generated from raw data using the Framingham Risk Score for participants in the Systolic Blood Pressure Intervention Trial (SPRINT).
Design Secondary analysis of SPRINT data published in The New England Journal of Medicine (NEJM) and made available to researchers in late 2016.
Setting SPRINT clinical trial sites.
Participants Study participants enrolled into SPRINT.
Results The number of SPRINT study participants identified as having ≥15% 10-year cardiovascular risk was not consistent with what was reported in the original publication. Using the data from the trial, the Framingham Risk Score indicated ≥15% 10-year cardiovascular risk for 7089 participants compared with 5737 reported in the paper, a change from 61% to 76% of the total study population.
Conclusions The analysis of the clinical trial data by independent investigators identified an error in the reporting of the risk of the study population. The SPRINT trial enrolled a higher risk population than was reported in the initial publication, which was brought to light by data sharing.
- clinical trials
- hypertension
- cardiovascular risk
- open data
This is an open access article distributed in accordance with the Creative Commons Attribution Non Commercial (CC BY-NC 4.0) license, which permits others to distribute, remix, adapt, build upon this work non-commercially, and license their derivative works on different terms, provided the original work is properly cited, appropriate credit is given, any changes made indicated, and the use is non-commercial. See: http://creativecommons.org/licenses/by-nc/4.0/.
Statistics from Altmetric.com
Strengths and limitations of this study
We analysed data made available to researchers to generate a 10-year Framingham Risk Score and shared our results with the National Institutes of Health.
We explain the reason that Systolic Blood Pressure Intervention Trial (SPRINT) study participants were at higher cardiovascular risk than initially understood, which helps to inform the generalisability of the trial’s results.
We did not have access to full SPRINT data; there may be additional data that are not available to researchers at this time which could help explain the findings.
We were unable to explain the cardiovascular risk of 575 SPRINT study participants.
Introduction
In April 2017, the New England Journal of Medicine (NEJM) hosted a summit on ‘Aligning Incentives for Sharing Clinical Trial Data’, with the aim of providing a demonstration of the benefits of clinical trial data sharing.1 In the months leading up to the summit, NEJM launched the Systolic Blood Pressure Intervention Trial (SPRINT) Data Analysis Challenge, which offered researchers access to the SPRINT clinical trial database in order to provide a real-world demonstration of the benefits of clinical trial data sharing. Investigators from around the world used the SPRINT data to produce novel research abstracts that were shared publicly. The SPRINT data are now available via the Biologic Specimen and Data Repository Information Coordinating Center (BioLINCC).2
SPRINT, a randomised clinical trial sponsored by the National Institutes of Health, compared a more intensive systolic blood pressure target (<120 mm Hg) with a standard target (<140 mm Hg) among non-diabetic patients aged 50 or older with hypertension and with known cardiovascular disease or known elevated risk for cardiovascular disease.1 After observing significantly fewer cardiovascular events among patients allocated to the more intense treatment regimen, the Data Safety and Monitoring Board stopped the trial early, and the primary results were published in NEJM on 26 November 2015.
Our research group planned to use the SPRINT data as part of the SPRINT Data Analysis Challenge. We first sought to determine if we could replicate the information in the main publication. As part of this effort, we calculated the 10-year Framingham Risk Scores (FRS). The published SPRINT paper reported that 61% of the participants were identified as having ≥15% 10-year cardiovascular risk based on the FRS.3 We found that this number did not match with what we calculated from the raw data made available from BioLINCC. We emailed our findings to the coordinator of the NEJM Challenge from whom we received a response quoting a BioLINCC official, ‘The equation appears to have originally been calculated with the coefficients for treated systolic blood pressure and untreated systolic blood pressure reversed’ (personal communication). In this report, we describe our mathematical analysis of this discrepancy and its implications.
Methods
Data source
BioLINCC provided the data underlying the primary publication of the SPRINT results. These data were organised into five datasets: patient baseline information, blood pressure readings over time, primary and other outcomes, patient status at the end of intervention and adverse events.
Data variables
The variable of interest was the reported FRS, denoted by a variable labelled ‘risk10yrs’ in the baseline information data set. We also used the seven variables included in the FRS: age, total cholesterol, high-density lipoprotein cholesterol, systolic blood pressure, antihypertensive medication use, current smoking status and sex. As a result of the exclusion criterion, no SPRINT participants had diabetes, another FRS variable, at baseline.
Risk score calculation
We calculated the FRS using the sex-specific formulas derived originally from the Cox proportional hazards models in a 2008 paper by D’Agostino et al using the seven variables above.4 The NEJM Challenge coordinators confirmed that the D’Agostino et al’s regression model (hereafter referred to as the ‘true’ model) was appropriate for calculating the 10-year risk used in SPRINT (personal communication).
The continuous variables were (natural) log-transformed. Regression coefficients for each variable (table 1) were calculated via the Cox model in D’Agostino’s paper. If we represent the variables as  (
( is log(age),
  is log(total cholesterol), etc) and their corresponding coefficients as
  , then for each patient we can form the linear combination of the above variables and coefficients, given by
  . With this calculation, the final risk score for women is given by
Regression coefficients for Cox regression model used to predict cardiovascular disease risk4
 .
.
and for men by
 .
.
Statistical analysis
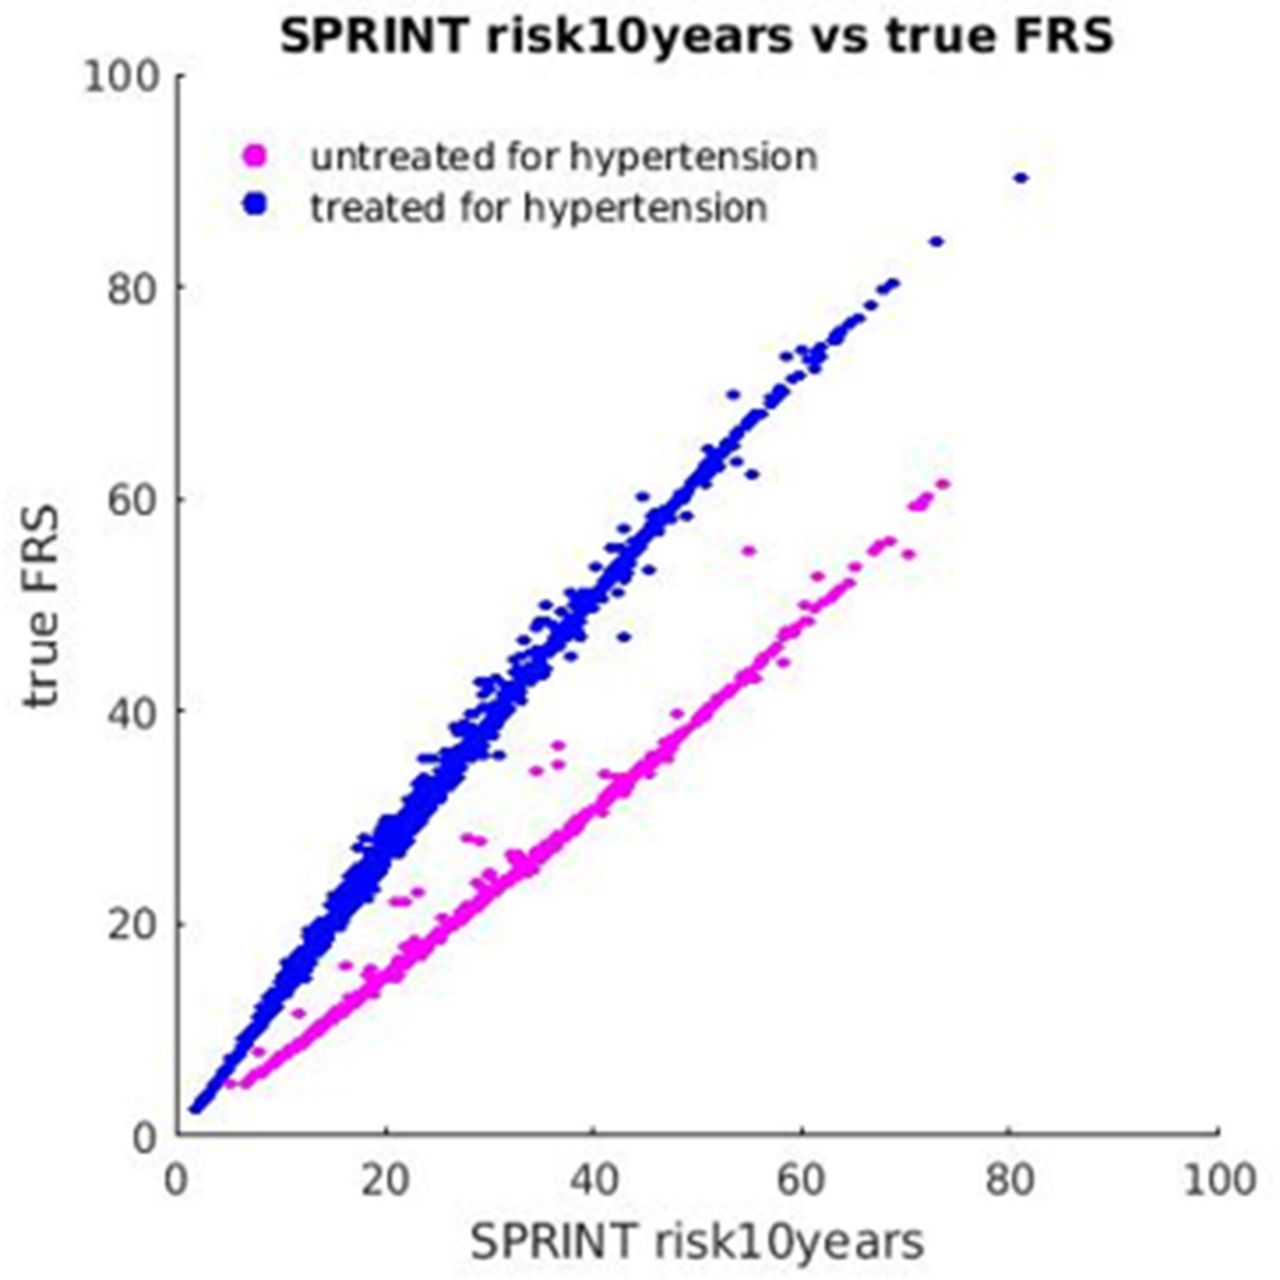
We compared our calculated FRS values with those in the risk10yrs variable. We then also calculated the percentage of participants with ≥15% 10-year risk by the calculated score and compared it with the ≥15% 10-year risk by the risk10yrs variable and the published result in the original SPRINT paper.3 We created a scatter plot of the provided risk10yrs variable against our calculated FRS, stratified by patients previously treated for hypertension and those previously untreated for hypertension (figure 1).

Scatter plot of the risk10years variable versus the calculated variable using the true model.4 Colour is used to indicate the correct blood pressure treatment status of study participants. This figure illustrates the effect of interchanging the prior antihypertensive medication use variable—the Framingham Risk Score (FRS) is underestimated for those being treated and overestimated for the untreated population.
We tested the effect of interchanging the coefficients for the treated systolic blood pressure and untreated systolic blood pressure formula in our calculated FRS in order to verify the validity of the explanation provided to us for the discrepancy. The Yale University Human Investigation Committee approved our analysis of SPRINT data.
Patient and public involvement
Neither patients nor the public were involved, as the research is a secondary analysis of data from the SPRINT trial.
Results
We used the data from all 9361 study participants in SPRINT.
Comparison of risk10yrs with published result
Table 1 of the original SPRINT manuscript indicates that the number of participants whose FRS is ≥15% was 2870 and 2867 for intensive and standard treatment, respectively. The mean±SD of the FRS values were 20.1%±10.9% and 20.1%±10.8% for intensive and standard treatment, respectively. All of these data agree with the numbers calculated using the risk10yrs variable provided to SPRINT Challenge participants.
Comparison of calculated and reported risk score
Our calculated FRS using the true model were not consistent with the reported scores in the risk10yrs variable. Specifically, 7089 (76%) patients had ≥15% 10-year cardiovascular risk according to the calculated score versus 5737 (61%) using the score determined from the provided risk10yrs variable. The mean±SD 10-year cardiovascular risk was 24.8%±12.5% for the calculated score versus 20.1%±10.9% for the score based on the risk10yrs variable.
The SPRINT Challenge variable InclusionFRS, derived from risk10yrs variable, indicated that 5737 patients were included based on ≥15% 10-year risk. This number was consistent with the data presented in table 1 of the original SPRINT manuscript, indicating a discrepancy between results calculated from the SPRINT data and the SPRINT publication.3 4
As illustrated in figure 1, our calculated FRS was lower than the risk10yrs variable for previously untreated patients and higher for previously treated patients. The overall effect, since 91% were previously treated and treatment is associated with higher risk, was to represent the SPRINT study population as having lower 10-year cardiovascular risk than it truly had.
Interchanging the coefficients produced a risk score matching the risk10yrs variable for 8711 (93%) SPRINT participants but failed to reproduce the published FRS results for 585 (6.3%) SPRINT participants. For 10 of these participants, the risk reported in risk10yrs agrees exactly with the correct formula and not the formula with the reversed coefficients. For the remaining 575 participants, we were unable to either replicate or explain the published FRS results.
Discussion
After receiving access to the data underlying SPRINT through the SPRINT Data Analysis Challenge, we found an error in the FRS calculations in the SPRINT publication.3 SPRINT’s primary publication erroneously stated that 61% of patients had ≥15% 10-year cardiovascular risk, instead of the true value of 76%. The FRS was one of the four eligibility criteria for SPRINT and the most common (accounting for eligibility of 61.3% of all study participants). Therefore, understanding the subset of study participants at ≥15% risk at enrolment is critical to understanding the SPRINT study population and considering the real-world population to whom the study results could be generalised.
Of note, this information does not change the results of the trial, but rather shows the study’s particular relevance for high-risk individuals, as more participants fit into the high-risk category than initially thought. The new American College of Cardiology/American Heart Association Blood Pressure Guideline relied heavily on SPRINT in making recommendations to lower the treatment target for which pharmacological therapy should be initiated for high-risk individuals.5 The finding also supports the decision by the National Institutes of Health and the SPRINT investigators to share their data by showing a benefit of data sharing. The error in the main paper has now been corrected.6 We note that this correction gives 7103 participants at ≥15% risk instead of the 7089 we cite here. This is due to the fact that our analysis was restricted to participants who were assigned an FRS in the SPRINT Challenge data.
Some questions persist. BioLINCC has stated that the population at ≥15% risk was determined at a pre-baseline screening visit (not reported in the main paper), but these data were not available to SPRINT Challenge participants.7 Therefore, it is not possible to determine the effect of the incorrect calculation on the inclusion criteria and whether the calculation was used to make these determinations. Additionally, the reversing of the coefficients for treatment, which was suggested as the coding error responsible for the error, does not fully explain the discrepancy.
This correction highlights an often-overlooked benefit of data sharing in medicine: error identification and correction by reproducing research to verify previously published research findings. Many researchers report having failed to reproduce their own scientific experiments, or an experiment of a colleague, and are just now beginning to establish procedures to foster scientific reproducibility.8 Clinical trial data sharing is likely the best method to facilitate reproducibility in the clinical sciences. The sharing of data can enable the wisdom of crowds to emerge, proper questioning and clarification of methods and ultimately a greater understanding of particular studies. Moreover, sharing empowers other researchers to ensure that the contributions of the patient participants and scientists who create a study are honoured by generating as much clinically—and scientifically—relevant knowledge from the study as possible.
In conclusion, the SPRINT Data Analysis Challenge demonstrated how clinical trial data sharing enables increased knowledge generation to improve clinical practice and scientific understanding. Our analysis and the NEJM correction illustrate a secondary benefit to data sharing, namely that data sharing allows for outside researchers to reproduce existing analyses, and in that process, discover any errors. Even in this highly curated, limited data set, known to be shared with the public and constructed by experts in the field, we found an error that was likely the result of a simple miscode for most patients. Of note, any study is vulnerable to such errors, and the SPRINT investigators should be credited with a willingness to have the data examined by others. Greater availability of clinical trial protocols and underlying data sets would allow for novel investigations as well as greater verification and reproducibility of existing investigations, strengthening confidence in trial results and conclusions.
Footnotes
Contributors FW and HMK conceived and designed the work. FW wrote the first draft of the manuscript. FW, SSD, JSR, PD, KM and HMK analyzed and interpreted the data, revised the work critically for important intellectual content and approved the submitted version. FW and HMK are accountable for all aspects of the work in ensuring that questions related to the accuracy or integrity of any part of the work are appropriately investigated and resolved.
Funding The authors have not declared a specific grant for this research from any funding agency in the public, commercial or not-for-profit sectors.
Competing interests Drs HMK and JSR are recipients of research agreements from Medtronic and Johnson & Johnson (Janssen), through Yale, to develop methods of clinical trial data sharing and of a grant from Medtronic and the Food and Drug Administration, through Yale, to develop methods for postmarket surveillance of medical devices and work under contract with the Centers for Medicare and Medicaid Services to develop and maintain performance measures that are publicly reported. Dr HMK chairs a cardiac scientific advisory board for United Health, is a participant/participant representative of the IBM Watson Health Life Sciences Board, is a member of the Advisory Board for Element Science and the Physician Advisory Board for Aetna and is the founder of Hugo, a personal health information platform. Dr JSR has received research support from the Blue Cross Blue Shield Association to better understand medical technology evidence generation. The other co-authors report no potential competing interests.
Patient consent Not required.
Ethics approval Yale University Human Investigation Committee.
Provenance and peer review Not commissioned; externally peer reviewed.
Data sharing statement The SPRINT data we used are available via the Biologic Specimen and Data Repository Information Coordinating Center (BioLINCC).