Article Text

Abstract
Objective The current study was undertaken for use of the decision tree (DT) method for development of different prediction models for incidence of type 2 diabetes (T2D) and for exploring interactions between predictor variables in those models.
Design Prospective cohort study.
Setting Tehran Lipid and Glucose Study (TLGS).
Methods A total of 6647 participants (43.4% men) aged >20 years, without T2D at baselines ((1999–2001) and (2002–2005)), were followed until 2012. 2 series of models (with and without 2-hour postchallenge plasma glucose (2h-PCPG)) were developed using 3 types of DT algorithms. The performances of the models were assessed using sensitivity, specificity, area under the ROC curve (AUC), geometric mean (G-Mean) and F-Measure.
Primary outcome measure T2D was primary outcome which defined if fasting plasma glucose (FPG) was ≥7 mmol/L or if the 2h-PCPG was ≥11.1 mmol/L or if the participant was taking antidiabetic medication.
Results During a median follow-up of 9.5 years, 729 new cases of T2D were identified. The Quick Unbiased Efficient Statistical Tree (QUEST) algorithm had the highest sensitivity and G-Mean among all the models for men and women. The models that included 2h-PCPG had sensitivity and G-Mean of (78% and 0.75%) and (78% and 0.78%) for men and women, respectively. Both models achieved good discrimination power with AUC above 0.78. FPG, 2h-PCPG, waist-to-height ratio (WHtR) and mean arterial blood pressure (MAP) were the most important factors to incidence of T2D in both genders. Among men, those with an FPG≤4.9 mmol/L and 2h-PCPG≤7.7 mmol/L had the lowest risk, and those with an FPG>5.3 mmol/L and 2h-PCPG>4.4 mmol/L had the highest risk for T2D incidence. In women, those with an FPG≤5.2 mmol/L and WHtR≤0.55 had the lowest risk, and those with an FPG>5.2 mmol/L and WHtR>0.56 had the highest risk for T2D incidence.
Conclusions Our study emphasises the utility of DT for exploring interactions between predictor variables.
- Diabetes
- Interaction
- Decision tree
- Data Mining
- Prediction
This is an Open Access article distributed in accordance with the Creative Commons Attribution Non Commercial (CC BY-NC 4.0) license, which permits others to distribute, remix, adapt, build upon this work non-commercially, and license their derivative works on different terms, provided the original work is properly cited and the use is non-commercial. See: http://creativecommons.org/licenses/by-nc/4.0/
Statistics from Altmetric.com
Strengths and limitations of this study
We used a large population-based sample for our study.
The direct measurements of glucose value and anthropometric indices were used rather than self-reported information for predictor variables and outcome.
Our study proposes a new approach for detecting interactions between predictors.
There were no data available on the dietary intake among participants.
External validity did not perform for the derived prediction models.
Introduction
The prevalence of type 2 diabetes (T2D) mellitus has been increasing rapidly over the past decade. Around 366 million people worldwide had diabetes mellitus in 2011, and this number is expected to reach 552 million by 2030.1 Several risk factors, such as age, sex, ethnicity, family history, obesity and hypertension, are well documented. However, detecting the precise interaction of these and other risk factors with one another is a complex process that varies both within and across populations.2–4
During the past two decades, dozens of prediction models for diabetes have been developed using logistic or Cox regression models,4 ,5 while recently a systematic search of those multivariable models has shown that few reported prediction models contain interactions, and it seems that few researchers examine them.6 There are a number of reasons for not using interactions in traditional statistical methods. First, there are generally many possible predictor variables in medical research which make the task of variable selection difficult. Hence, traditional statistical methods are poorly suited for this type of multiple comparisons. Second, many clinical variables are not normally distributed and different groups of participants may have markedly different degrees of variations. Third, assessment of interactions, using the traditional regression models, requires prespecification of the interaction terms, for example, in a linear model involving outcome Y, and two predictor variables (x1 and x2), the product term x1x2 is the common representation of the two-way interaction effect. As the number of variables in the model increases, the number of possible interactions that can be investigated is large and leads to a complicated model that can be difficult to fit and interpret.6 ,7 Non-parametric regression has been introduced in 1963 which are another class of simple regression models for explanation and prediction nowadays known as ‘recursive partitioning’ or ‘decision trees’ (DT). Many variants and extensions of the tree methods have been published in the past 50 years, which have been widely used in many fields such as machine learning, data mining and pattern recognition.8 ,9 Recursive partitioning is a statistical method for exploration of interactions or non-linear relationships among explanatory variables, identification of different subgroups, detection of the most important variables in those subgroups, and finally offering a new way to look at complex data.8 ,10 ,11 Since there will never be enough resources to implement every prevention programme for all target groups, health policymakers prefer interventions that target high-risk groups.12 Therefore, DT models might be helpful for identifying different groups which allow implementation of specific interventions for each group according to their risk probabilities (low-risk and high-risk groups).
The aim of this study was to develop a series of classification trees for adult men and women based on three commonly used DT algorithms (Classification and Regression Tree (CART), Quick Unbiased Efficient Statistical Tree (QUEST) and commercial version (C5.0)) to gain more information on interactions between factors contributing to the incidence of T2D. We used the Tehran Lipid and Glucose Study (TLGS) database for our analysis.
Methods
Study population
The TLGS, an ongoing prospective study, has been described in detail elsewhere.13 Briefly, the baseline study (phase 1) was performed from 1999 to 2001, with follow-ups in three consecutive phases, 2002–2005 (phase 2), 2005–2008 (phase 3), and the last 2009–2012 (phase 4). After the cross-sectional phase (phase 1), participants were assigned to a cohort and a prospective interventional study. For this study, 10 368 participants aged ≥20 years from the first phase were selected and followed from the date of enrolment through phase 4; moreover, in the second phase, 2440 new participants entered and were followed in the next two phases (3 and 4). We excluded participants with prevalent T2D at baseline (n=1376) and those with missing data regarding fasting plasma glucose (FPG) and 2-hour postchallenge plasma glucose ( 2h-PCPG) (n=1122). Overall, 3663 (35%) participants were lost to follow-up and 729 new cases of T2D were identified by the end of phase 4 (figure 1). The written informed consent was obtained from each participant.

Flow diagram for the selection of study participants in the Tehran Lipid and Glucose Study. 2h-PCPG, 2-hour postchallenge plasma glucose; FPG, fasting plasma glucose.
Clinical, anthropometric and laboratory measurements
Information on demographics, education, smoking status, physical activity, and medical and drug history was collected by interview. For women, additional information on reproductive history, menstruation status and interventions to prevent pregnancy was collected using a pretested questionnaire. Anthropometric measures including weight, height and waist circumference (WC) were measured, according to a standard protocol.14 Body mass index (BMI) was calculated as weight (kg)/height (m)2. Waist-to-hip ratio (WHpR) was calculated as WC/hip circumference and waist-to-height ratio (WHtR) was calculated as WC/height. Systolic and diastolic blood pressure (SBP and DBP, respectively), and blood parameters such as FPG, 2h-PCPG, triglycerides (TGs), total cholesterol (TC) and high-density lipoprotein cholesterol (HDL-c) were measured using previously reported methods.15 TGs to HDL-c ratio (TG/HDL) ratio was obtained as TG/HDL-c and TC-to-HDL-c (TC/HDL) was calculated as TC/HDL-c.
Definition of variables and outcome
Education level was categorised to five levels as illiterate, 1–5 years, 6–12 years, 13–16 years and more than 16 years schooling. Marital status was categorised as single, married, widowed and divorced. A current smoker was defined as a person who smokes cigarettes daily or occasionally. Former smokers were defined as individuals who have smoked daily or occasionally and who had quit smoking. Passive smoking was defined as exposure to secondhand cigarette smoke in the home, at work or in other environments. A family history of premature cardiovascular diseases (CVD) was considered as any experience of fatal or non-fatal myocardial infarction, stroke or sudden cardiac arrest in first-degree relatives, if it occurred before 55 years of age in male relatives and before 65 years of age in female relatives. A history of CVD was defined as previous ischaemic heart disease and/or cerebrovascular accidents. A family history of diabetes (FHD) was defined as having T2D in first-degree relatives. On the basis of their self-reported levels of leisure time physical activity, participants were categorised into two groups in which ‘inactive’ means those doing exercise or labour less than three times a week or performing activities achieving lower than 600 MET. Mean arterial blood pressure (MAP) was obtained as ([(2×diastolic)+systolic]/3).16 Pulse pressure was defined as SBP minus DBP. Participants were grouped into two categories based on participating in the lifestyle intervention. Women were categorised into three groups on the basis of their menstruation status: having normal menstrual cycle by taking medication, normal menopause, early menopause because of surgery or other reasons. Women were also categorised to six levels considering pregnancy prevention methods: use of hormonal contraceptive drugs, intrauterine devices (IUDs), using condoms, withdrawal method, tubectomy/vasectomy and not applicable. They were also categorised into two groups based on birth history, a history of hypertension and hyperglycaemia in pregnancy. Incidence of T2D (outcome variable) was defined based on an FPG≥7.0 mmol/L or 2h-PCPG≥11.1 mmol/L or taking antidiabetic medication in all phases of the study.17 Final data sets consisted of 6647 cases (3762 women) which included 54 and 44 primary predictor variables in women and men, respectively.
Statistical methods
Data preparation
Data were prepared before analysis. Data preparation included: missing data handling, variables selection, defining the train and validation data sets and balancing the train data sets.
Missing data handling
Results of the Little's missing completely at random (MCAR) test18 on the primary set of predictor variables showed that in men the pattern of missing data was completely at random (MCAR) (p=0.15), but for women missing values were not MCAR (p<0.001).19 We used single imputation for imputing the missing data. For imputation, all the primary variables were included, except for the outcome variable. Continuous variables were imputed by the CART method,10 using SPSS modeler (V.14.2.0.3, IBM), and for categorical variables we applied the weighted K-Nearest Neighbor approach using RapidMiner (V.5).20
Training and validation data
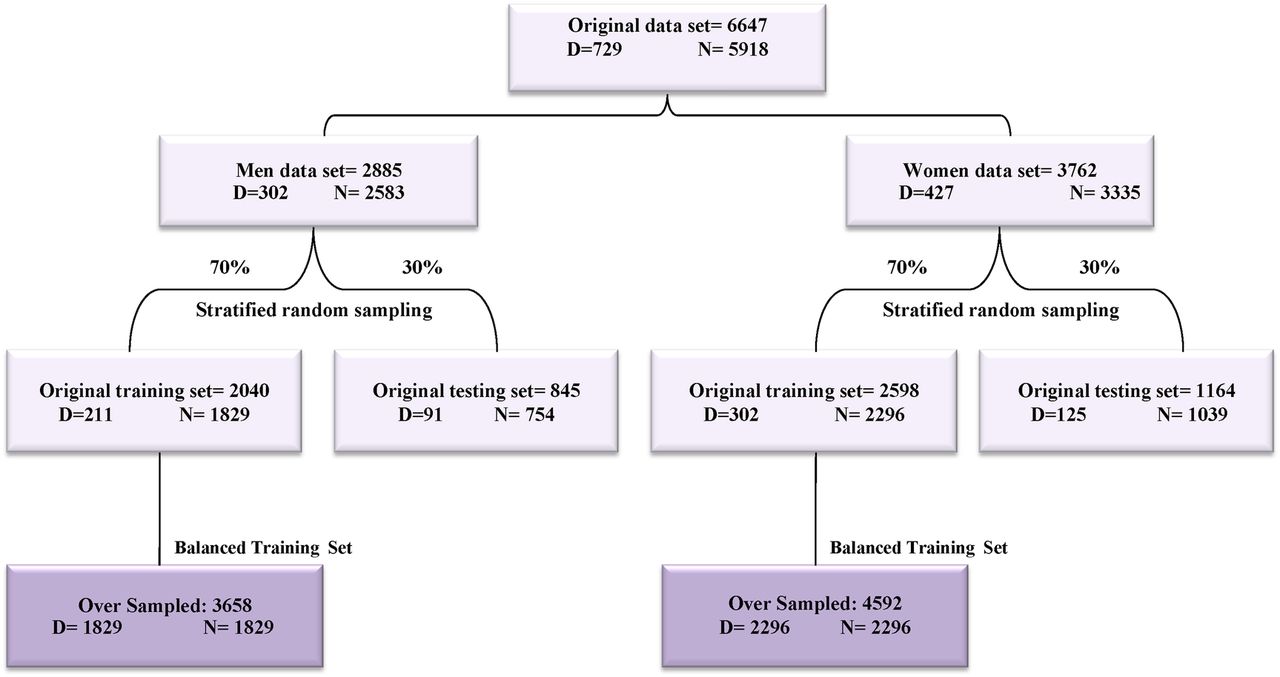
The entire data sets of men and women were divided into two sets using stratified random sampling: a training set consisted of 70% of the data for model development, and a test or validation set consisted of the remaining (30%) for model validation (internal validation) (figure 2).

Generation of training and validation data set diagram.
Data balancing
Most of the popular classification algorithms such as DT work well when the positive and negative cases are evenly distributed and problems arise when the data set is imbalanced.21 The class imbalance in medical data occurs when there are many more cases of some classes (majority class or negative) than others (minority class or positive).22 In such cases, standard classifiers tend to produce high accuracy over that of the majority class.23 There are a finite number of solutions to handle imbalanced data sets.21–23 In our previous work, we showed the effectiveness of Synthetic Minority Oversampling Technique (SMOTE) for handling imbalanced data sets.24 In this study, we balanced two training data sets of men and women using SMOTE as previously reported (figure 2).24
Variables selection
Variable or feature selection methods have been used since the 1970s in the fields of statistics and machine learning techniques.25 Variable selection methods have been shown to be effective in removing redundant and irrelevant variables, improving prediction performance of learning algorithms and reducing the effects of high dimensionality in the data.26 Therefore, in order to identify the best subset of variables while retaining the predictive power of the original variables, we applied the multivariate filter approach, using correlation-based feature selection and consistency-based feature selection as two evaluation criteria in conjunction with the Best First, Genetic Algorithm as two search strategies.27 Therefore, four subsets of variables were selected using a combination of the two search strategies and two evaluation criteria. To arrive at the final set, the four subsets were reviewed to choose the variables that were observed at least in two subsets. Variable selection methods were applied on the training data sets after imputation of missing data. We used the Weka toolkit (V.3.2.) for selecting variables.
Statistical analysis
Baseline characteristics were compared between participants with and without T2D across men and women. Also, characteristics were compared between followed up versus non-followed up participants. Comparisons were done using Student's t-test and χ2 with a two-tailed p<0.05 being considered significant.
Methods for DT modelling
There are many different algorithms for fitting tree-structured models coming from different communities.9 ,28 All the DT algorithms generate a set of classification rules and construct a DT. A tree has three types of nodes: root node, internal node and terminal nodes. Both the root and the internal nodes are partitioned into two nodes in the next layer; however, the terminal nodes do not have offspring nodes. The root node contains the learning sample from which the tree is grown. The basic process of developing a DT includes three elements: the selection of variable for splits the data (splitting criteria), stopping rule to decision of when to stop splitting a node and mark it terminal, and the pruning methods.8
To choose the right algorithm for our problem, we applied three types of DT algorithms which are widely used for generating a binary tree: the CART algorithm,8 QUEST29 and C5.0.30 All the DT models were performed using IBM SPSS modeler 14.2.
Model evaluation
Performances of the models were evaluated on the test or validation data sets. In data mining, the classifier is basically evaluated by accuracy, sensitivity, specificity, positive predictive value (PPV), negative predictive value (NPV) and the area under the curve (AUC). When data are imbalanced, accuracy performs better on the majority classes (negative cases). The geometric mean (G-Mean), however, indicates the balance between model performance on the negative and positive classes and avoids overfitting to the negative class.31 1
1
F-Measure, harmonic mean of PPV (precision) and sensitivity (recall), is another measure that increases proportionally to the increase of precision and recall. A high value of F-Measure indicates that the model performs better on the positive class.31 ,32 We chose sensitivity and G-Mean for comparison of the models and select the best one. 2
2
Results
Missing data analysis showed that about 59% and 70% of primary variables (44 and 54 in men and women, respectively) had at least two missing data. The ranges of missing data were (0.1–6%) and (0.1–5%) in the women and men data set, respectively. Using the variable selection methods, 15 and 20 variables were identified to include in the model building process for men and women, respectively. The percentage of missing data for selected variables has been shown in tables 1 and 2.
Baseline characteristics of men (TLGS 1999–2012)
Baseline characteristics of women (TLGS 1999–2012)
Characteristics of participants
Baseline characteristics of the study population are presented in tables 1 and 2. During a median 9.5 years of follow-up (IQR 6.13–10.2 years), T2D developed in 302 men (10%) and 427 women (11%). Comparison of baseline characteristics between the followed and non-followed participants (only for selected variables) is shown in tables 3 and 4. Followed men had higher value for TC/HDL (5.5 vs 5.4), but lower age (41.8 vs 43.4 years). The proportion of individuals with low education levels (≤5 years) was higher in followed men (20.5% vs 26.2%). Followed women had lower value for age (39.6 vs 40.5 years), pulse pressure (39.3 vs 40.2 bpm) and MAP (89.2 vs 89.9 mm Hg). The proportion of illiterate women was lower in followed women (8.1% vs 13.2%).
Baseline characteristics of followed up and non-followed up men (TLGS 1999–2012)
Baseline characteristics of followed up and non-followed up women (TLGS 1999–2012)
Model performances
We constructed the DT models using the balanced training data sets with two set of variables: (1) selected variables that included 2h-PCPG, and (2) selected variables without 2h-PCPG. The performance measures for the two types of DT models are shown in tables 5 and 6. Comparison between models 1 and 2 shows that by removing 2h-PCPG from the variables list, the sensitivity for all three models decreases by 5–10% and 2–5% in men and women, respectively. Results show that QUEST has the highest sensitivity and G-Mean among all models for both men and women; therefore, we chose it as the best DT models.
Performances of the decision tree models for men (Tehran Lipid and Glucose Study 1999–2012)
Performances of the decision tree models for women (Tehran Lipid and Glucose Study 1999–2012)
DT analysis in men
Figure 3 depicts the DT for model 1, including the predictor variables and the cut-off points for each predictor. It used four variables (FPG, 2h-PCPG, age and WHtR) for classification and generated seven decision rules; each rule identifies a special subgroup with a certain probability of outcome (positive or negative) for each person belonging to that subgroup. The FPG, located on the top of the tree, was the most important factor in incidence of T2D.

Decision tree for model 1 in men. Performance measures: sensitivity: 78%, specificity: 72%, G-Mean: 0.75, AUC: 0.78. 2h-PCPG, 2-hour postchallenge plasma glucose; AUC, area under the curve; FPG, fasting plasma glucose; G-Mean, geometric mean; WHtR, waist-to-height ratio.
Table 7 shows the seven subgroups identified by the DT of model 1. Each group was specified by a combination of variables that identified a probability for incidence of T2D. For example, group 1 (low risk) consisted of men with an FPG<4.9 mmol/L and 2h-PCPG<7.7 mmol/L who had a 10% probability for incidence of T2D in the study period. Group 7 (high risk) consisted of men with an FPG>5.3 mmol/L and 2h-PCPG>4.4 mmol/L who had a 79% probability for incidence of T2D. The observed risk pattern in each subgroup revealed the interaction between a set of variables; that is, the patterns for group 2 show that in men with an FPG of 4.9–5.3 mmol/L and 2h-PCPG<7.7 mmol/L, risk of incidence depends on the value of WHtR. There was also an interaction between FPG, 2h-PCPG and age such that age >43 years increased the risk of T2D among men who had an FPG>5.3 mmol/L and 2h-PCPG≤4.4 mmol/L (groups 3 and 6). In model 2 (without 2h-PCPG), 9 subgroups were identified. The DT used four variables (FPG, WHtR, MAP and FHD) for classification (table 7). Results showed that FPG was the most important predictor for incidence of T2D; men with an FPG<4.9 mmol/L had a lower risk, but with FPG above 5.3 mmol/L, the risk of incidence depended on the WHtR and MAP.
Groups identified by decision tree models for men (Tehran Lipid and Glucose Study 1999–2012)
DT analysis in women
The DT created for women is shown in figure 4. The model used three variables (FPG, 2h-PCPG and WHtR) for identification of seven subgroups (table 8). Group 1 (low risk) consisted of women who had an FPG≤5.2 mmol/L and WHtR≤0.55 (12% probability for incidence of T2D). Group 7 (high risk) consisted of women who had an FPG>5.2 mmol/L and WHtR>0.52 (81% probability for incidence of T2D). The observed patterns in the subgroups show that when the FPG level is <5.2 mmol/L, WHtR and 2h-PCPG are the most important factors in incidence of T2D, whereas if FPG is >5.2 mmol/L, WHtR is the most important factor. Some types of interactions were observed between FPG, WHtR and 2h-PCPG in women; for example, the patterns in groups 4 and 7 show that in women with an FPG>5.2 mmol/L, T2D incidence will increase by about 55% with an WHtR of over 0.52. In model 2 for women, in which we excluded 2h-PCPG from the variables list, nine subgroups were identified using three variables (FPG, 2h-PCPG and MAP). This model had a lower sensitivity than model 1. Different interactions were found by this model; that is, when FPG is >5.2 mmol/L, WHtR≥0.56 is the most important risk factor for T2D, whereas when FPG is <5.2 mmol/L, WHtR and MAP play an important role in T2D incidence.
Groups identified by decision tree models for women (Tehran Lipid and Glucose Study 1999–2012)

Decision tree for model 1 in women. Performance measures: sensitivity: 78%, specificity: 78%, G-Mean: 0.78, AUC: 0.81. 2h-PCPG, 2-hour postchallenge plasma glucose; AUC, area under the curve; FPG, fasting plasma glucose; G-Mean, geometric mean; WHtR, waist-to-height ratio.
Discussion
In this study, we used the three types of DT-based methods to provide insight into the factors that have an important role in the incidence of T2D and how these factors might interact to reveal specific subgroups. We used the more established and widely available algorithms to select the one with the best performance. Considering sensitivity and G-Mean, QUEST had the best performance in both men and women data sets. Although our study focused on exploration of interactions, DT models can be used for predicting the 9 years risk of developing T2D. Also, it is possible to identify who needs more or different treatments if we take interactions into account.
Two sets of variables were used for DT development. In model (1), we used selected variables which included 2h-PCPG, and in model (2), we excluded the 2h-PCPG from the variables list. Results of QUEST showed that although four similar predictors had the highest power both in men and women, they had different interaction patterns in the two genders; for instance, women with WHtR≤0.52 had a lower risk (26%) for T2D even with an FPG level of above 5.2 mmol/L. However, in men, the results showed that when FPG is >5.3 mmol/L, there was still 56% of T2D risk, even with a lowering of WHtR to below 0.45. A systematic review of existing evidences has shown that the mean of suggested cut-off values for WHtR in men and women, respectively, was 0.52 and 0.53 for incidence of T2D.33 However, the results of this study showed that the recommended cut-off of 0.52 for WHtR is not a safe value for decreasing the risk of T2D among men,since significant risk of T2D was observed among men with WHtR≤0.45, as we pointed out above. Therefore, men with WHtR below 0.52 should not be given false assurances about their risk of incident T2D if their FPG level is >5.3 mmol/L.
A review of current studies shows that being aged >40 years is a risk factor fordeveloping T2D.34Theresults of our study show that age ≥43 years is a risk factor for men who have an FPG level >5.3 mmol/L. Results from this study confirm previous findings about the FPG cut-off point, obtained using traditional methods; additionally, we found the FPG cut-off point for men and women separately. For instance, two published studies of TLGS have shown that individuals with FPG levels <5.1 mmol/L are very unlikely to develop T2D during 6 and 9 years follow-up.35 ,36 This study shows that among men with an FPG level <4.9 mmol/L, there is only 14% risk for T2D incidence within about 9 years. Another interesting finding of our study was the important role of MAP in incidence of T2D in men and women. There are very few studies assessing the role of MAP in T2D incidence. Based on some previous studies, hypertension has been recognised as a risk factor for incident T2D in various populations.37 The inter-related pathophysiology of hypertension and T2D is complex and not fully understood.38 Our study showed that an MAP of ≥92 mm Hg is a risk factor among men with an FPG>5.3 mmol/L even if WHtR is <0.49. In women, an MAP of ≥97 mm Hg is a risk factor when WHtR is >0.66, even if the FPG level is ≤5.2 mmol/L. These results imply that the co-occurrence of a high level of MAP and central obesity among women is a risk factor for T2D, whereas in men an increased level of FPG and MAP together is a risk factor for T2D. A simple point score system has recently been developed based on the TLGS database, including SBP, FHD, WHtR, TG/HDL-c and FPG as predictors;39 continuous variables such as FPG and WHtR were, however, categorised into three or four groups. In other words, the cut-off points were predefined for prediction of T2D. In our study, DT algorithms generated optimal cut-off points for these variables as they relate to the best classification of participants with and without T2D.
Some strengths of this study include a large population-based sample. We used direct measurements of glucose value and anthropometric indices rather than self-reported information for both predictor variables and outcomes. Applying two variable selection methods with two evaluation criteria, missing data imputation and construction of DT models for both genders are other notable strengths. We have described the methodology in detail, allowing medical researchers to perform similar studies in different domains using DT methods.
The limitation of this study is the 35% loss to follow-up rate, although a number of authors have proposed a value of 50–80% as an acceptable level of follow-up rates.40 In this study, we found statistically but not clinically important differences between the followed versus non-followed population in some baseline variables. The followed men had a higher value for the TC-to-HDL ratio, but lower age. In women, age, pulse pressure and MAP were lower for the followed population. Since these factors were associated with T2D, the results may be biased towards an underestimation of the association between these risk factors such as age and MAP and T2D. Additionally, we did not have data on dietary intake, which is an important factor in T2D studies. Finally, the models need to be validated on an independent population considering the ethnic and racial variations in T2D incidence.
Conclusions
DT analysis identified different interactions between predictor variables of T2D incidence in men and women. Sensitivity and G-Mean were measured on the validation data and showed acceptable performance of the DT models. Our results showed that WHtR and FPG were important risk factors in women and men, respectively.
Acknowledgments
The authors wish to acknowledge Ms Niloofar Shiva for critical editing of English grammar and syntax of the manuscript.
References
Footnotes
Contributors FA and FH designed the study protocol, and participated in the coordination and management of the study. AR performed the statistical analysis and wrote the manuscript. EH, JS and OP participated in the statistical analysis and interpretation of data. All authors read and approved the final manuscript.
Funding This study was supported by grant number 121 from the National Research Council of the Islamic Republic of Iran.
Disclaimer The funding source had no role in the design, in the collection, analysis and interpretation of data, in the writing of the manuscript, and in the decision to submit the manuscript for publication.
Competing interests None declared.
Patient consent Obtained.
Ethics approval This study was approved by the Ethical Committee of the Research Institute for Endocrine Sciences.
Provenance and peer review Not commissioned; externally peer reviewed.
Data sharing statement No additional data are available.