Article Text

Abstract
Background Recruitment for clinical studies is challenging. To overcome barriers, investigators have previously established call-to-entry rates to assist in planning. However, rates specific to low-income minority populations are needed to account for additional barriers to enrolment these individuals face.
Objective To obtain a call-to-entry rate in a low-income uninsured Hispanic population with chronic disease.
Methods We used data from four of our randomised clinical studies to determine the call-to-entry rate for individuals (n=1075) with or at risk for type 2 diabetes: participants needed/potential participants contacted=recruitment rate (yield). Research staff contacted potential participants to enrol in a study that evaluated 6 month diabetes programmes at community clinics from 2015 to 2020. We recorded call-to-entry rates, reasons for declining the study, show rates, and attrition.
Results The call-to-entry rate was 14.5%. Forty per cent of potential participants could not be contacted, and 30.6%, 19.1%, and 5.4% responded yes, no, and maybe, respectively. No show percentages were 54% for yes and 91.4% for maybe responders. The majority (61.6%) declined due to inability to attend; reasons to decline included work (43%), eligibility (18%), transportation (10%), out of town (9%), did not think they needed the programme (7%) and other/unknown (14%). Being a physician predicted inability to reach participants (adjusted OR 2.91, 95% CI 1.73 to 4.90). Attrition was 6.8%.
Conclusions We described a call-to-entry rate and detailed recruitment data, including reasons to decline the study. This valuable information can assist investigators in study planning and overcoming enrolment barriers in low-income populations. Telehealth-based or strategies that limit transportation needs may increase participant involvement.
Trial registration number NCT03394456.
- diabetes
- community health workers
- recruitment
- telehealth
- low-income
- clinical trial
This is an open access article distributed in accordance with the Creative Commons Attribution Non Commercial (CC BY-NC 4.0) license, which permits others to distribute, remix, adapt, build upon this work non-commercially, and license their derivative works on different terms, provided the original work is properly cited, appropriate credit is given, any changes made indicated, and the use is non-commercial. See: http://creativecommons.org/licenses/by-nc/4.0/.
Statistics from Altmetric.com
Strengths and limitations of this study
Investigators analysed recruitment data from four randomised clinical trials.
All participants (n=1075) were from an understudied minority and resource-limited population.
Investigators collected detailed information, including reasons for declining the study, show rates, and attrition.
Investigators explored a potential value of incorporating Community Health Workers in recruitment processes.
The study is limited by lack of generalisability as it includes a low-income Hispanic population with or at risk for diabetes.
Introduction
Recruitment is a known challenge in clinical studies, particularly in low-income communities.1 2 Data from a recent clinical study revealed an under-representation of uninsured participants (n=24,332) and of those living in geographic areas with lower socioeconomic levels.3 Low-income populations face higher levels of mistrust in the health system, language and cultural concerns, transportation challenges, limited health literacy, and medical record deficiencies.1 4–7 Investigators have found that socioeconomic issues are a major reason individuals decline study participation.8 Specifically, clinical studies often lack key facilitators such as community participation and cultural appropriateness, including incorporating Community Health Workers (CHWs).1 4–6 9 10 Consequently, fewer disadvantaged individuals are represented in clinical studies despite having higher rates of chronic disease.11 This raises concerns for implicit bias, fairness, and objectivity in evidence-based guidelines and interventions.12
CHWs or promotores traditionally are educators, which has encouraged recent efforts to incorporate them into research teams.13 CHWs are of particular interest for Hispanic communities to address cultural and linguistic barriers and obtain sensitive data that may be pivotal to overcome recruitment barriers.14–16 National samples have noted potential CHW roles in research.13 However, the majority of interventions that incorporate CHWs in research involve data collection, and there is a paucity of literature describing their involvement in recruitment for clinical trials.14–16
Estimating the number of individuals whom research staff will need to contact to achieve recruitment goals is vital in the recruitment process.1 4 It allows investigators to plan effective real-world studies by communicating database needs with clinic stakeholders, hiring staff, obtaining retention plans, and forecasting training needs.17 Previous investigators have established call-to-entry rates, N/C=R, where N=participants needed, C=potential participants contacted, and R=recruitment rate (yield), to aid in clinical study planning.18 19 However, recruitment data from low-income populations remain under recorded.
Nearly three decades ago, the National Institutes of Health provided recommendations to increase the representation of people with low socioeconomic status. Yet, investigators still struggle to provide diversity in research.1 20 Unmet recruitment goals lead to underpowered studies with inconclusive or skewed results, further contributing to an ongoing cycle of disparities for low-income populations in clinical studies.17
In the current study, we aimed to analyse our recruitment data from four randomised clinical trials that evaluated a diabetes programme for resource-limited Hispanics.7 21 22 We outlined methodological approaches to gather a call-to-entry rate in this population and explored the value of incorporating CHWs into recruitment processes.
Methods
In this cohort study, we analysed our recruitment data from four randomised clinical trials that evaluated a multidimensional programme for low-income, uninsured Hispanics with or at risk for type 2 diabetes.7 21 22 Specifically, we describe the methods used to obtain a call-to-entry rate in this population, including reasons to decline the study, show rates, and attrition. Detailed methodologies of the parent studies were previously described;7 21 22 the studies occurred at community clinics in greater Houston, Texas from 2015 to 2020. Recruitment occurred 5 weeks before study baseline; follow-up occurred for a minimum of 1 month (cohort 1) and up to 24 months (cohorts 2–4) after study termination pending study protocols.23 Data were collected from recruitment to follow-up.7 21 22
Potential participants were identified through a clinic database. Participants met inclusion criterion if they were Latino(a)/Hispanic adults with type 2 diabetes or pre-diabetes (International Classification of Disease (ICD)−10 E11.X; R73.09).7 21 22 Exclusion criteria included type 1 diabetes, not appropriate for group care (eg, require >1 diabetes-related appointments per month), inability to understand Spanish, pregnancy, and any condition that could alter haemoglobin (Hb) A1c levels (eg, varying chronic steroid doses of >10 mg and blood transfusion in the last 3 months). Measures to reduce bias included participant randomisation, blinded data collection, standardised recruitment processes, and independent analysis of the results by other researchers.7 21 22
Figure 1 provides the steps involved in the 5 week recruitment process, from contacting potential participants to study start. From the clinic database, research staff contacted participants telephonically to explain the study and invite them to a study orientation that occurred an average of 2 weeks after the initial call. Staff recorded responses as yes, no, or maybe. For those who declined, staff recorded the reason. If individuals informed the staff that they were ineligible, that is, not Hispanic or did not have diabetes, they were recorded as coded incorrectly. If individuals could not be reached, staff made four additional attempts at various times and on weekdays and weekends. If voicemail was available, staff left a message with non-identifying patient and programme information and a callback number. If the phone number was not correct or disconnected, alternative numbers were sought in the electronic medical record (EMR). If no alternatives were present, staff recorded wrong number.

Steps involved in the recruitment process, from contacting potential participants to study enrolment.
Staff called potential participants who responded yes or maybe the day prior to orientation to confirm attendance. At orientation, staff gathered baseline data and informed consent. During a 2 week period from orientation to study start, a physician conducted a secondary chart review to ensure all participants met eligibility criteria.
Recruitment staff for the four cohorts were bilingual (English/Spanish) and consisted of seven CHWs, one clinic administrator, and one physician. CHWs received 3 hours of training that included instructions on reading a script in Spanish to participants.
Measures
In addition to recording potential participant responses, the research team recorded the number who showed at orientation and who were excluded after secondary physician chart review. These data were used to obtain a call-to-entry rate. Other measures included study retention. We also explored CHW vs physician recruitment data.
Statistical analysis
We conducted the statistical analysis in Stata V.17.1, StataCorp (College Station, Texas). Continuous variables were presented as mean (SD) and categorical variables as count (percentage), and results were totalled for the four cohorts. We classified participants’ responses when contacted by research personnel, whether participants showed to orientation, and reasons for declining to participate using counts (percentages). We then calculated the call-to-entry rate: N/C=R. We explored determinants of inability to contact participants using logistic regression models adjusted for age, sex, and if contacted by a CHW or physician.
In the primary studies, loss to follow-up and missing data were managed by each trial independently. For example, they used employed multiple imputation procedures for missing clinical values. In the current study, researchers were assigned patients to call and recorded responses on an online, secure spreadsheet. During the recruitment process, investigators reviewed the spreadsheet routinely to ensure data were recorded appropriately and in the case of missing data, for example, reason for declining not present, contacted the researcher directly to input the data. This resulted in obtaining 100% of calling data for the current study. We did not gather the contact person for the first cohort and, thus, did not include in this portion in the analysis.
Patient and public involvement statement
Involvement included design, conduct, and dissemination of information. Specifically, CHWs were involved to provide informed decisions regarding patients’ priorities, experiences, and references. Through qualitative and quantitative surveys, CHWs gathered patient information to guide practices, that is, study design, conduct, any burden of the intervention, and recruitment. Patients received ongoing communication with providers regarding their clinical outcomes, that is, HbA1c, blood pressure, and weight. CHWs were certified by the state of Texas, bilingual or Spanish-speaking, and self-identified as Hispanic. Texas CHW certification requires 160 hours of coursework or 1000 hours of community service in the last 3 years and 20 biennial continuing education hours.
Results
Figure 2 illustrates 1075 (male=402 (37.4%)) potential participants and loss at each step of the recruitment process with attendant numbers and percentages. Forty per cent (n=430) could not be contacted (received voicemail, n=304; wrong number, n=126), and 4.9% (n=53) informed staff that they were not Hispanic or did not have type 2 diabetes, resulting in 592 (55.1%) individuals who staff successfully contacted. After a total of 19.1% (n=205) declined the study, 36.0% (n=387) remained, of which 239 responded yes and 58 responded maybe. Individuals averaged 54.0 years old (SD±10.2).

Flowchart illustrating potential participants contacted to achieve a call-to-entry rate in a low-income Hispanic population (n=1075).
Staff called potential participants who responded yes or maybe the day before orientation. Seventy individuals who confirmed did not show to orientation (yes: 70, maybe: 0). Of those who did not confirm, 162 did not show (yes: 109, maybe: 53), leaving 155 (14.4%). An additional eight individuals who initially declined or received voicemail showed, resulting in 15.2% (n=163). Secondary chart review excluded seven individuals. The final study n for the four cohorts was 156. All individuals were Hispanic, low-income, and uninsured. The majority (>50%) were undocumented immigrants.
These data resulted in a call-to-entry rate of 14.5%, where:


This equation may be altered to assist in project planning to estimate the number of potential participants needed to contact (C), where

For example, for a desired cohort of 80 participants (N) and a yield of 14.5% (R), a total of 552 potential participants are needed to contact (C) to meet study goals:

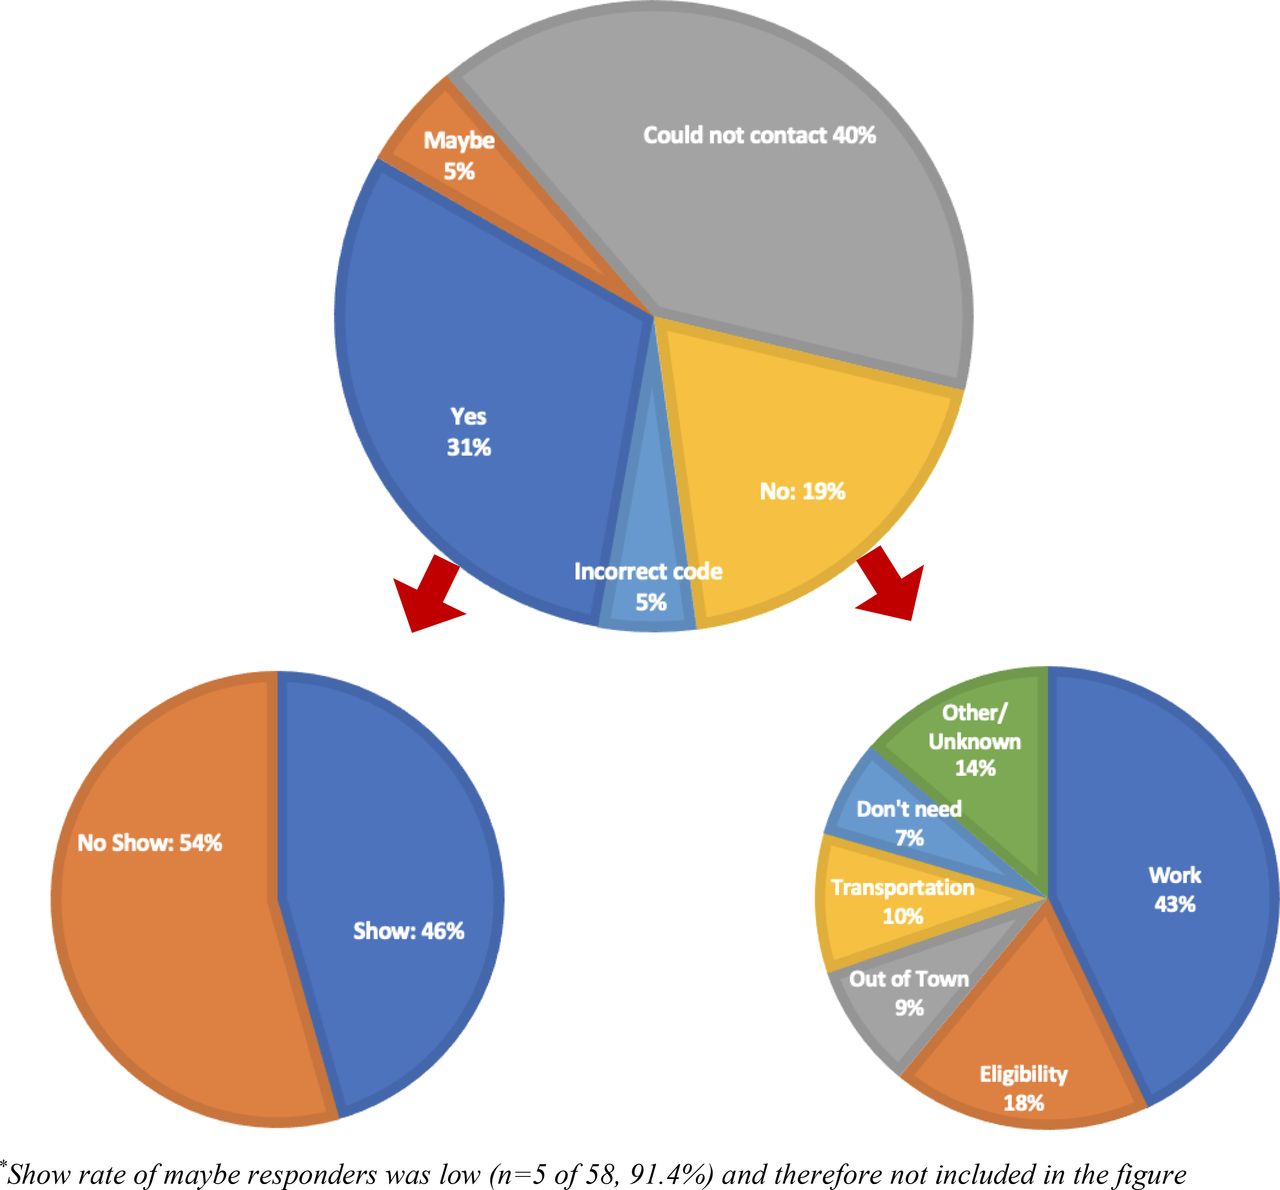
Figure 3 (top) illustrates the flowchart in figure 2 and further stratifies the yes responders to show and no show (figure 3, bottom left) and the reasons individuals declined (figure 3, bottom right). More than half (54%) of yes responders did not show. Fifty-eight individuals responded maybe, but the vast majority (n=53/58, 91.4%) did not show to orientation and were, therefore, not included in the figure. Of the yes responders who confirmed attendance the day prior to orientation (n=171), 100 (58.5%) showed, and of the maybe (n=1), 1 (100%) showed. The most common reason to decline was due to work (43%). The least common reason was that they did not think they needed the programme (7%). Other reasons to decline included eligibility (18%), transportation (10%), out of town (9%), other/unknown (14%). The majority (61.6%) of individuals declined the study due to inability to attend: work, transportation, and out of town.

Responses of potential participants (top) delineated into show rates of individuals who responded yes with show rates (bottom left) and no with the reasons to decline (bottom right).
Participants were less likely to respond no to the physician than a CHW (physician: 4.3%, CHWs: 18.6%; p<0.0001). There were more individuals who responded yes to CHWs who showed to the study compared to those who said yes to the physician, though this was not significant (CHW: 41.5%, physician: 33.3%; p=0.44). An adjusted logistic regression analysis revealed that the physician was a significant predictor of an inability to reach participants compared with CHW (adjusted OR 2.91, 95% CI 1.73 to 4.90).
Attrition was low at the study end (6 months, 6.8%).
Discussion
This study demonstrated the methodologies in recruitment for low-income, uninsured Hispanics. Study findings included identifying a call-to-entry rate of 14.5%. In addition, many (40%) could not be contacted at all and most (61.6%) declined the study due to inability to come to the study site. Obtaining these recruitment data in a low-income setting is a valuable step to strategize clinical research studies, communicate database needs with study sites, and achieve recruitment goals. This is essential to appropriately power studies, provide accurate results, and reduce discrimination in resource-poor settings, thereby reducing a cycle of disparities in clinical studies.17
There are important considerations for sources of potential variations in call-to-entry rates among differing sites and populations. Nearly half (40%) of our potential participants could not be contacted; the degree to which EMRs are updated will affect the call-to-entry rates. Additionally, due to transportation and work barriers in low-income populations, investigations with several opportunities for study entry, such as multiple orientation days, and those located near to participants’ homes are more likely to receive a yes response. Furthermore, we observed that potential participants provided more detailed information to CHWs than the provider or administrator, including reasons to decline the study, which provided helpful information for planning subsequent investigations. Participants were also more likely to decline the study when contacted by a CHW. While this finding may be interpreted as CHWs being less successful at recruitment, participants may have been more comfortable giving frank answers to CHWs when unable to participate. Consistent with this interpretation, exploratory data showed that more potential participants showed when recruited by a CHW than by a physician.
Other investigators who evaluated similar populations demonstrated the potential variation of data. A randomised clinical trial evaluating low-income Hispanics with type 2 diabetes at five community health centres and had screening processes that included primary care physician oversight started with an initial pool of 1176 patients but, after screening, had 487 potential participants.24 Of the 487 eligible patients, 56.6% responded yes, and the remaining 43.4% declined or could not be contacted. Retention rates averaged 85% at study end (12 months). Investigators emphasised the importance of addressing patient-related challenges for successful recruitment.24 On the other hand, in a 24 month investigation of 2,631 potentially eligible individuals, of whom the majority had annual household incomes <$35,000, the majority (81.2%) were not eligible or did not complete their baseline assessment, 4.9% declined, and 13.9% met entry criteria and responded yes.25 Study retention was 86% at 24 months. Investigators noted the value of taxi vouchers, after-hours appointments, and community engagement to enhance retention.25
There is a call in health intervention research to partner with community members, but there is a dearth of information detailing strategies.15 Facilitators of participation, including culturally appropriate methods, community involvement, and language sensitivity, are vital to overcome barriers.1 4–6 9 10 CHWs are well positioned to overcome cultural and linguistic barriers, obtain sensitive data, address social determinants of health that providers often cannot, and have the potential to play key roles in research teams.13–16 26
Strengths of the study are providing information to assist in study planning and overcoming recruitment barriers in low-income communities.1 2 For example, our data demonstrated that it is unlikely (91.4%) for those who responded maybe to show, suggesting that when resources are limited, investing in these individuals may not be the best strategy. Additionally, we found that the most common reason to decline was due to an inability to attend; alternative intervention modalities (eg, telehealth/telephonic) may enhance the reach of the target population. We also explored incorporating CHWs in the recruitment process to gather data and involve communities. Limitations of the study include lack of information on why individuals who confirmed attendance did not show to orientation. Generalisability is also limited, as the study includes a low-income Hispanic population with a diabetes, which could result in a selection bias; however, it is unlikely that one call-to-entry rate can generalise across all populations and diseases. Finally, larger investigations that incorporate CHWs in recruitment processes are needed to gain a better understanding of their value in recruitment.
Conclusions
This study provides valuable information to assist in recruitment planning in low-income populations. Call-to-entry rates, reasons to decline the study, and show rates are crucial for successful clinical research study implementation. Improving the ability to recruit low-income populations increases the ability to meet study goals and provide valuable data, thereby lessening health disparities among vulnerable populations. Future studies are warranted to explore recruitment data for diseases, conditions, and ethnicities.
Ethics statements
Patient consent for publication
Ethics approval
This study involves human participants and was approved by Baylor College of Medicine (IRB# H-40322). Participants gave informed consent to participate in the study before taking part.
References
Footnotes
Contributors EV, CJ, VC, and AN contributed to the study conception, design and data collection; MAR contributed to the study analysis and interpretation of results, and EV, SV, MAR, LP, ZSD, SLS, AD, and VS contributed to the manuscript preparation. EV is responsible for the overall content as guarantor, accepting full responsibility for the finished work and the conduct of the study, had access to the data, and controlled the decision to publish.
Funding This work was supported by the National Institutes of Health, National Institute of Diabetes and Digestive and Kidney Diseases (DK129474, DK1110341). Additional support was provided by the Center for Innovations in Quality, Effectiveness, and Safety at the Michael E. DeBakey VA Medical Center, Houston, TX, World Heart Federation, and the Tahir and Jooma Family.
Competing interests None declared.
Patient and public involvement Patients and/or the public were involved in the design, or conduct, or reporting or dissemination plans of this research. Refer to the Methods section for further details.
Provenance and peer review Not commissioned; externally peer reviewed.