Article Text

Abstract
Background Poor health, including chronic pain, has been consistently shown to be associated with lower socioeconomic status (SES).
Objective To describe the SES of a clinical population of children with chronic pain referred to tertiary care in England, and to determine if access to, and utilisation of, the service is related to SES.
Patients and methods Using a retrospective cross-sectional study design, all children referred to a tertiary chronic pain management service between 2000 and 2014 were included. SES was determined using the English Index of Multiple Deprivation for the area in which they lived. Distance from the study site, using Ordinance Survey National Grid coordinates, and service utilisation, from hospital records, were also calculated.
Results 737 children were included. The proportion of patients referred from the most socially deprived areas was substantially lower (14%) than from the least deprived (25%). In addition, the proportion of patients from the most deprived areas fell with increasing distance from the study site. Patients from the most deprived areas were more likely not to attend hospital appointments.
Conclusions Contrary to expectations, there were fewer patients from the most deprived areas. The proportion of children from more deprived areas fell with increasing distance from the study site, and those children who were referred were less likely to attend scheduled appointments. Our results imply that there is a social gradient in access to tertiary services for children's chronic pain management.
- Pain
- Epidemiology
- Health Service
Statistics from Altmetric.com
What is already known on this topic
Low socioeconomic status (SES) is associated with an increased prevalence of chronic pain in adults and children.
Socioeconomic factors, however, are frequently ignored in potentially relevant research studies.
What this study adds
There were fewer children in the clinic population from the most deprived areas than expected.
The proportion of children from the most deprived areas fell with increasing distance from the referral centre.
Patients of lower SES were more likely to not attend scheduled appointments.
Introduction
Inequalities in health and access to healthcare are well documented, with people of lower socioeconomic status (SES) generally experiencing worse health and more barriers to treatment.1–5 Chronic pain is a significant and costly health problem6 and studies have frequently found a greater prevalence and severity of chronic pain in groups of low SES in adults and children.7 ,8 Nevertheless, research on SES and access to chronic pain treatment is limited, especially in children, and socioeconomic factors are often ignored in potentially relevant research studies.9 ,10
We conducted a study with the aims of establishing the SES of a clinical population of children with chronic pain seen at a Highly Specialist Children's Chronic Pain Service (HSCCPS) in England, and to determine if access to, and utilisation of, the service is related to SES.
Methods
Background, subjects and exclusions
The HSCCPS at Great Ormond Street Hospital for Children, London, England, is a UK-National Health Service (NHS) tertiary referral centre for children with chronic pain (broadly defined as pain of more than 3 months' duration that causes impairment of day-to-day functioning and quality of life). The service sees children and young people up to the age of 18 years, offering a multidisciplinary and rehabilitative approach to management. Patients are assessed at a multidisciplinary face-to-face appointment where a management plan is formulated. Subsequent follow-up is by telephone, with further face-to-face contact at intervals determined by patient's progress.
Prior to planning this retrospective cross-sectional project, appropriate institutional approvals were obtained. This included compliance with information governance regulations. All patients referred to the HSCCPS from February 2000 to December 2014 were identified from electronic health records. Patients whose permanent address was outside England were excluded.
Socioeconomic status
Patients' SES was determined using the English Index of Multiple Deprivation (IMD), a publicly available data set that provides information on social deprivation by area. The IMD scores neighbourhoods (lower-layer super output areas (LSOAs)) on the basis of seven domains of deprivation: income; employment; health; education, skills and training; housing and services; crime and living environment. These subscales are combined into one multiple deprivation score and the LSOAs are ranked in order of decreasing deprivation and grouped into quintiles.
Until 2011, there were 32 482 LSOAs in England of similar population quantities (stable average of about 1500 individuals). Patients were mapped to LSOAs by matching their postcode centroid to an LSOA using the National Statistics Postcode Lookup (NSPL) database11 (a National Statistics database which provides alternative geographical units for UK postcodes). Once the relevant IMD rank was obtained, patients were categorised according to the quintile which contained the LSOA in which the patients lived.
Access inequalities were analysed by first comparing the proportion of patients seen by the service in each deprivation quintile with the proportion of children in each quintile in England. Population data were obtained from the Office for National Statistics (ONS).12 These data, available at LSOA level, date to mid-2008 (the same period covered by the 2010 IMD). If there were no inequalities in access, the proportion of patients would be the same as the proportion of children in each quintile. Because the geography is not uniform across the country, that is, the South of England is generally less deprived than the rest of the country, and because most patients were expected to come from this area, it was necessary to further analyse access inequalities by Region.
The IMD has been used in a range of studies including the Health Survey for England on chronic pain,8 on access to services13 and in predicting pain interference in adults.14 At the time our study was carried out, there were three IMD editions: 2004,15 200716 and 2010.17 The 2015 edition18 was not available. The 2010 edition uses data to 2008, the 2007 edition, data to 2005 and the 2004 edition, data to 2003. Patients referred to the service in or before 2004 were categorised according to IMD 2004, patients referred between 2005 and 2007 inclusive were categorised according to IMD 2007 and patients referred in or after 2008 were categorised according to IMD 2010. The methodology of each is equivalent. Children who lived outside England were excluded because deprivation indices for other countries are not readily comparable with the IMD owing to different methodologies.
Included in the IMD data set are two subscales which form part of the IMD and which are given separately. These are the Income Domain Affecting Children Index and the education Children and Young People Score. The overall IMD score, rather than these two scores, was used because: first, the concept of multiple deprivation is much wider than either income or education alone; second, to remain consistent with other studies in children and adults that have used the IMD score and thereby facilitate comparison and third, because the health and life chances of children are very heavily influenced by their parents and it is therefore necessary to consider deprivation faced by the family unit as a whole.
Distance
Distance between the HSCCPS and each patient's home was calculated and analysed by area deprivation. Ordnance Survey (OS) National Grid coordinates corresponding to the study site and each patient's postcode were obtained using NSPL. Distance between the study site and each patient's home was calculated using the OS recommended Pythagorean triangulation method.19
Service utilisation
A number of programmed face-to-face and telephone consultations with the service, and non-attendances, were obtained from electronic records and were analysed by area deprivation. Rates of face-to-face and telephone appointments were calculated for patients with the service for at least 1 year.
Data linkage and statistical methods
Data linkage was conducted in Microsoft Access 2003 and Excel 2010. The statistical computing environment R V.3.0.3 (R: a language and environment for statistical computing [program]. 3.0.3 version. Vienna, Austria: R Foundation for Statistical Computing, 2013) was used for analysis. Where relevant, differences in proportions were tested using χ2 or, where categories were ordered,  . Continuous data were analysed using one-way analysis of variance (ANOVA). Normality was assessed by visual examination of histograms and homoscedasticity was tested with Bartlett's test. Kruskal–Wallis was used where transformations were needed but failed. Tests were unpaired and two-tailed. Alpha level was set at p<0.05 (exact p values are reported). Maps were produced in R by combining IMD data with ONS shapefiles.20 Patient coordinates, supplied by NSPL as OS Eastings and Northings, were reprojected to longitude and latitude.21 IMD and ONS data were used as per the Open Government Licence.22
Results
Subjects
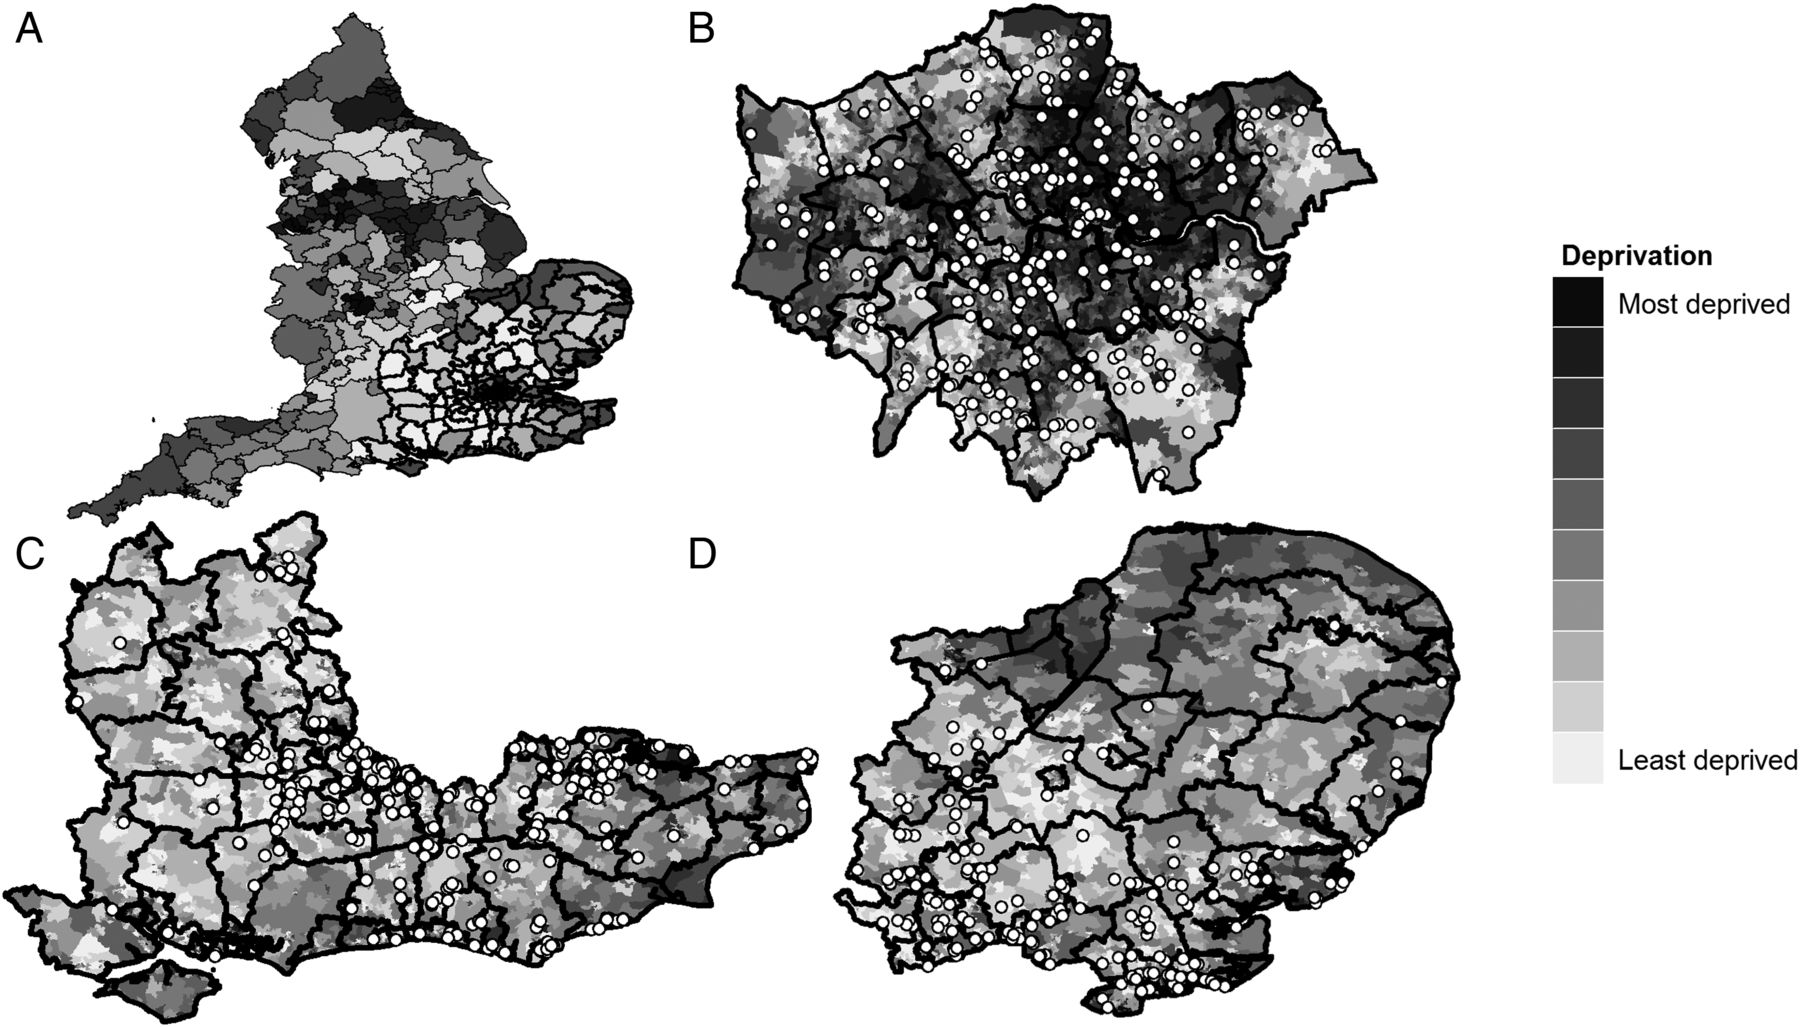
Seven hundred and fifty-one ‘patients’ were referred to the service. Fourteen were excluded because they did not live in England (n=11 from Wales, Scotland, Jersey, Ireland and Malta) or it was impossible to determine their permanent address (n=3). The final sample was 737 patients: 495 girls and 242 boys. The mean age was 13.7 (SD 3.3) years. Ninety-four per cent came from just three English Regions: London (286, 39%), the South East (225, 31%) and the East of England (182, 25%; figure 1B–D).

Maps of England (A), London (B), the South East (C) and the East of England (D). The local authority boundaries in Map A highlighted in bold correspond to Maps B, C and D. Each point on Maps B–D represents one patient. Maps B–D show the locations of 94% of patients referred to the clinic. The remaining 6% came from outside of these Regions. In Map A, the local authorities are shaded according to a population-weighted average level of deprivation. In Maps B–D, each lower-layer super output area is shaded according to its Index of Multiple Deprivation (IMD) rank decile.
Socioeconomic status
Table 1 shows the number of children according to deprivation quintile by Region (shaded columns) and the corresponding distribution of patients. For England as a whole (table 1, Columns 1 and 2), if there was no relationship between deprivation, chronic pain and access to the HSCCPS, then the proportion of patients in each quintile would match the proportion of children in each quintile nationally. In fact, 14% of patients lived in the most deprived quintile, whereas 25% lived in the least deprived quintile.
Deprivation of the study sample and childhood population (n=737) by Region
Regionally, the pattern was different. For patients in the Regions nearer the study site, the pattern of deprivation more closely matched that of children in the general population in those Regions; in London, for example (table 1, Columns 3 and 4), the proportion of patients who lived in each quintile is similar to the distribution of deprivation among children in London generally. There was still, however, some under-representation of children from the more deprived areas (26% of patients in the clinic vs 30% of children in the population) and over-representation of patients from the less deprived areas (11% of patients in the clinic vs 8% of children in the population).
Further away, in the South East, for example (table 1, Columns 5 and 6), 6% of patients lived in the most deprived quintile, as opposed to the 8% of children in that Region. These differences were most pronounced in Regions outside London, the South East and the East of England (‘Other Regions’, table 1, Columns 9 and 10), where only 14% of patients lived in the most deprived quintile nationally but 28% of children in those Regions were in the most deprived quintile nationally.
Distance
Average distance from patients' homes to the study site increased with decreasing deprivation. Patients from the most deprived quintile lived median (IQR) 8.2 (3.9–18.3) mi away. This rose to: in quintile 2, 14.2 (8.4–31.0) mi; quintile 3, 21.4 (9.4–39.8) mi; quintile 4, 26.4 (12.1–39.7) mi and quintile 5 (least deprived), 28.0 (16.3–38.4) mi (ANOVA p<0.0001).
Service utilisation
No differences were observed in the rate of either face-to-face consultations or telephone consultations by deprivation (table 2). There was, however, a gradient in the rate of non-attendances. Patients in the most deprived three quintiles had a non-attendance rate of about 10%. For patients from the two least deprived quintiles, this was about 6% ( p=0.003, table 2).
Rate of consultations with the study clinic
Discussion
In contrast to our hypothesis that more patients from more deprived areas would be referred for chronic pain management, we found that fewer patients from these areas were actually referred. In addition, patients from more deprived areas were more likely to live nearer the study site, and despite this they were more likely to not attend scheduled appointments. To our knowledge, this is the first study examining this issue in a UK children's chronic pain service and therefore the first to show potential socioeconomic inequalities in access to such a service.
Our results are consistent with other research. Less use of secondary care despite higher clinical need and use of primary care in groups of low SES have been documented in other health contexts.3–5 A study from a children's pain centre in Germany reported similar findings.23 Interestingly, they used a different measure of SES (individual-level parental occupational skill) finding that children whose parents had higher occupational skill levels were more likely to have travelled from outside the centre's 80% catchment area, and that the 80% catchment area increased with increasing parental skill level.
There are a number of possible explanations for these observations, including differences in clinical education, service provision, clinician and patient and family behaviours or economic costs to families. Inadequate coverage of pain on medical curricula has previously been criticised24 as has the lack of appropriate care for children in pain.10 ,25 Stigmatisation of patients with pain has also been cited as a cause of inadequate treatment.26 Access inequalities in chronic pain have also been attributed to differential treatment by clinicians based on patient's race.27 Families may have differing expectations of treatment, and not all families will seek medical intervention when their children have pain. Families of higher SES may be better able to research healthcare provision and request or demand referral to the study centre, which is well known, over an alternative service. However, there is research to suggest that poorer patients are not less likely to seek treatment than richer patients.28
Non-attendance rates may be related to travel costs although patients from the more deprived areas lived closer to the study site: travel costs are therefore proportionately lower, and there is a UK Healthcare Travel Costs Scheme29 whereby individuals who receive certain benefits or have a low income may be reimbursed hospital travel costs (uptake of this scheme among eligible families referred to the HSCCPS is unknown).
The IMD has been used to examine utilisation of a community paediatric service in Derbyshire, England, by SES.13 In this study, targeted service reconfiguration which involved training staff on the difficulties faced by deprived families led to greater access by children who lived in the most deprived quintile in comparison with the proportion of children in the population living in that quintile (70% vs 56%), as might be expected. They also found that the non-attendance rate in the most deprived quintile was much higher than the less deprived areas and that again, after intervention, the gap between the least and most deprived areas was reduced.
Although improving access by service reconfiguration has been shown to help in some circumstances, this approach has not been used in children's chronic pain and does not directly address the underlying reasons, which remain obscure. There are at present no nationally representative studies on the prevalence of chronic pain in children in the UK, and few studies examining socioeconomic predictors. Cross-sectional and longitudinal studies would fill these gaps. Research is also needed to understand how children with pain from more deprived backgrounds interact with healthcare services; the effect of clinician attitudes and pain education and to determine what barriers to pain management services exist.
Limitations
This was a single-centre study, albeit from a large and well-known tertiary children's hospital. Because of insufficient epidemiological data on children's chronic pain, it was not possible to precisely quantify predicted clinical need and statistically adjust for it. Nevertheless, as indicated in our hypothesis, we would argue that the available data suggest that children from the most deprived areas should be relatively over-represented. We used distance to the study centre rather than travel time. Although it has been shown that distance and travel time are highly correlated (r=0.98),23 for patients living in some areas, distance and travel time will not always correspond. Finally, the IMD does not provide data on deprived individuals, but deprived areas; individual-level socioeconomic data would be needed to construct more revealing statistical models.
Conclusions
Proportionately fewer children from more deprived parts of England were referred for specialist chronic pain management. In addition, the proportion of patients from the most deprived areas fell with increasing distance from the referral centre. Children from the most deprived areas were also more likely not to attend face-to-face appointments. Although reasons underlying these observations currently remain obscure, their nature and magnitude should be a cause for concern and warrant further investigation.
References
Footnotes
Contributors MAJ designed the study and conducted the data linkage and statistical analyses. MAJ and RFH contributed equally to data analysis and manuscript drafting.
Competing interests None declared.
Provenance and peer review Not commissioned; externally peer reviewed.