Article Text

Abstract
Objectives Heart failure (HF) is a commonly occurring health problem with high mortality and morbidity. If potential cases could be detected earlier, it may be possible to intervene earlier, which may slow progression in some patients. Preferably, it is desired to reuse already measured data for screening of all persons in an age group, such as general practitioner (GP) data. Furthermore, it is essential to evaluate the number of people needed to screen to find one patient using true incidence rates, as this indicates the generalisability in the true population. Therefore, we aim to create a machine learning model for the prediction of HF using GP data and evaluate the number needed to screen with true incidence rates.
Design, settings and participants GP data from 8543 patients (−2 to −1 year before diagnosis) and controls aged 70+ years were obtained retrospectively from 01 January 2012 to 31 December 2019 from the Nivel Primary Care Database. Codes about chronic illness, complaints, diagnostics and medication were obtained. Data were split in a train/test set. Datasets describing demographics, the presence of codes (non-sequential) and upon each other following codes (sequential) were created. Logistic regression, random forest and XGBoost models were trained. Predicted outcome was the presence of HF after 1 year. The ratio case:control in the test set matched true incidence rates (1:45).
Results Sole demographics performed average (area under the curve (AUC) 0.692, CI 0.677 to 0.706). Adding non-sequential information combined with a logistic regression model performed best and significantly improved performance (AUC 0.772, CI 0.759 to 0.785, p<0.001). Further adding sequential information did not alter performance significantly (AUC 0.767, CI 0.754 to 0.780, p=0.07). The number needed to screen dropped from 14.11 to 5.99 false positives per true positive.
Conclusion This study created a model able to identify patients with pending HF a year before diagnosis.
- heart failure
- preventive medicine
- public health
Data availability statement
No data are available. The scripts, but not the data itself, are shared.
This is an open access article distributed in accordance with the Creative Commons Attribution Non Commercial (CC BY-NC 4.0) license, which permits others to distribute, remix, adapt, build upon this work non-commercially, and license their derivative works on different terms, provided the original work is properly cited, appropriate credit is given, any changes made indicated, and the use is non-commercial. See: http://creativecommons.org/licenses/by-nc/4.0/.
Statistics from Altmetric.com
STRENGTHS AND LIMITATIONS OF THIS STUDY
A promising model for the prediction of heart failure based on both sequential and non-sequential general practitioner (GP) data was developed, outperforming simple demographics.
The prediction model shows a relatively low number of people needed to screen, which may be even further diminished when combined with an additional low-cost and non-invasive method such as ECG.
This study uses the true incidence ratio of heart failure in patients older than 70 years, indicating the performance is generalisable to the true population.
Sequential GP data did not include duration of the codes, potentially limiting performance.
Included algorithms are fairly basic. More advanced algorithms such as recurrent neural networks may increase performance further.
Introduction
Heart failure (HF) is a commonly occurring health problem, with an estimated incidence and point prevalence of 14.4 in 1000 and 7% in patients aged 55 years or older, respectively.1 It is expected that the prevalence is still growing, with an 22.7% increase in the USA in the period 2012–2030.2 The costs of HF are significant, adding up to 2% of healthcare expenses.3 4 Despite all care given, morbidity and mortality remain high. Of the patients diagnosed with HF, mortality after 30 days is 10.4%, which increases to 22% and 42.3% after 1 year and 5 years, respectively.5 If newly diagnosed patients can be detected earlier on as potential cases, it may be possible to intervene. Intervening may slow the progression to diagnosed HF in a number of patients and thereby improve quality of life, healthcare costs and life expectancy.6 Furthermore, early detection of patients may help in the creation of prospective studies to test the effect of (new) interventions, as the patients are not yet identified and thus the optimal intervention not yet defined.
Several options have been investigated which may help to diagnose HF in an early stage, but these all depend on additional measurements such as ECG, Positron Emission Tomography (PET)-CT, specific laboratory tests, etc.7–9 In addition to the extra work involved, there already has to be a suspicion of HF to perform these measurements, indicating that this is not a true screening measurement. Furthermore, this approach may lead to the testing of a lot of patients to detect HF in relatively few patients, leading to high costs and high loads on patients and clinicians. Predicting the probability of pending HF for every person in a (selection of a) population by reusing standard gathered data, that is, general practitioner (GP) data, minimises extra tests to high-chance patients only while creating a true screening method. This may result in less testing and thus a patient-friendly and cost-friendly screening tool. Since it is expected that patients with HF already have complaints, but that these are not indicated as such or related to a different disease, we hypothesise that the existing information for a screening tool is rich enough for early prediction of HF. However, for a screening tool, specificity should be high, because when combined with a low incidence, a model will quickly lead to a high number of false-positive predictions. Therefore, such a tool may be more beneficial when implemented in the GP practice to alert the GP of an increased risk of HF in the patient they are seeing at that moment, prompting further questioning about the complaints and the possible presence of HF.
A possible way to achieve such a tool is the application of machine learning models to diagnose or predict disease in patients. It is suggested that machine learning models can enhance GP care,10 11 that is, machine learning models based on electronic health record (EHR) data are capable of predicting HF before diagnosis with reasonable accuracy in a dataset with an artificial case:control ratio.12 13 However, clinical use is limited because (1) the artificial case:control ratio does not reflect the true population, which makes the performance upon implementation unknown, (2) patients are matched on age and gender, which helps in evaluating how well the machine learning model itself performs. However, since age and gender influence the chance of HF, it is an important variable to take into account in a screening algorithm, and (3) these models do not exploit interpretable time dependencies, for example, the development of ankle oedema after Chronic Obstructive Pulmonary Disease (COPD), which may improve the prediction of HF. Models that do exploit time dependencies for the prediction of HF are not interpretable or interpretable only for the influence of separate variables over time instead of the influence of the combination of sequential variables.13 14 Since interpretability is necessary for implementation, this limits clinical use. Interpretable sequences however may improve accuracy, as previous studies predicting colorectal cancer using GP data and heparin-induced thrombocytopenia use interpretable sequences which improve prediction accuracy.15 16
We hypothesise that a machine learning model incorporating EHR data from the GP as well as temporal patterns is able to give interpretable results on representable patient populations which are accurate enough to allow progress towards the next step, which is external validation followed by evaluation in a clinical setting. Therefore, our aim is to develop a model which is able to identify HF 1 year before the diagnosis occurred at the GP using data readily available from GP care, evaluated on a real-world incidence rate.
Methods
Data
Included data
General practice care data from the Nivel Primary Care Database were used, containing approximately 10% of the Dutch population, which is more than 1.7 million patients and a representative sample of the Dutch population.17 Data were obtained from the period 01 January 2012 up to 31 December 2019. Only patients of 70 years or older were selected, since incidence of patients younger than 70 years is very low (ie, 1.4 in 1000 person-years in the age range 55–59 years).1 Data consisted of patient demographics, health complaints, medication, diagnostics and chronic diseases. Patient demographics compromised an anonymised patient code, year of birth, gender, anonymised GP practice ID and start and end of the registration of the patient in the GP practice per 3 months. Health complaints were recorded as specified by the International Classification of Primary Care—version 1 (ICPC-1).18 The ICPC comprises codes to be used by the GP for the classification of complaints, diagnoses and symptoms, that is, code K77 for HF. GPs follow the guidelines of the Dutch Society of General Practitioners for the diagnosis of HF, which did not alter between 2012 and 2019. Medication was classified according to the Anatomical Therapeutic Chemical (ATC) scheme.19 The ATC scheme classifies medication into groups with a hierarchy up to five levels, from anatomical through therapeutic and pharmacological subgroups to a chemical subgroup. The ATC codes in this study were clipped to the second level (eg, beta-blocking agents, C07). The second level is selected as it contains relevant information while more detailed levels may lead to too much sparsity, resulting in less accurate predictions. Diagnostics contains each physical, laboratory or other measurement (ie, lifestyle advice, smoking or the advice to stop smoking) as performed by the GP and is described using the provided Dutch GP codes for diagnostics (NHG codes). For diagnostic measurements, both the measurement code and the corresponding outcome were extracted. Furthermore, dates corresponding to ICPC codes, ATC codes and diagnostics were present. In addition, chronic diseases or diseases in the past with a minimal duration of 1 year were specified as chronic diseases with the ICPC code and the corresponding start date.20
Excluded data
Patients were excluded if no valid continuous data period of at least 3 years was present between 01 January 2012 and 31 December 2019. A period of 3 years is selected, since data selection from a patient starts 2 years before diagnosis. Because diagnosis occurs randomly during a year instead of at the end of an included year, at least 3 continuous years are necessary. Furthermore, if data supplied from the GP office were incomplete (missing at least half of a quartile at the start or the end of a year) or if the GP practice contributed less than 500 patients, the corresponding year of the patients of the GP was excluded, as the average number of patients per full-time GP is 2095. If either medication data, ICPC data or diagnostics data were supplied less than 46 weeks in a year, the corresponding year for the GP was removed from the database. As the GP practice may be closed several weeks, this was not set at 52 weeks. Furthermore, the study administrative data underwent a quality improvement process, which is standard Nivel policy. For each participating practice, we checked whether they registered a meaningful ICPC code in at least 70% of their consultations.17 20 Meaningful ICPC codes were defined as codes in the range 1–29 or 70–99. R44 (vaccinations) and X37 (Pap smear) were also considered meaningful. ICPC codes A97 (no disease) and A99 (generalised illness) were not considered meaningful. This removal was performed since bad registration of ICPC codes leads to underestimation of the true incidence. In addition, in 85% of the cells containing medication, a valid ATC code should be registered. Patients with missing age or gender or with known HF before data collection were removed from the database.
Patient and public involvement
Patients or the public were not involved in the design, or conduct, or reporting, or dissemination plans of our research. It would be feasible to include patient feedback on the acceptability of the implementation of such an algorithm in the GP.
Additional preprocessing data
Diagnostic information was removed if the diagnostic code did not exist in the NHG database. Diagnostic codes 1966, 3850, 3581 and 1968 (four measures for (pro-) brain natriuretic peptide) are commonly but interchangeably measured indicators when HF is suspected. Due to the suspected importance of these variables and the similarity of the measurements, these were grouped together to give for each one of the four codes the same code, named ‘BNP’.
Data extraction
Target selection
The target variable was the diagnosis of HF (ICPC code K77). This target variable was indicated to be 1 if the patient had a GP consultation with the ICPC-1 code ‘K77’. The first consultation with this ICPC code was used as the date of diagnosis. For each case, a random control from the same GP practice was selected. Age and gender were not matched to cases, although age did have to be above the threshold of 70 years. The starting date of the control was randomly selected within the period of available data for the control while still leaving a long enough period of data. For each case, a control was present. Each control was included only once in the whole dataset. For each case, an observation window of 1 year ranging from −2 years to −1 year prior to the diagnosis was selected (figure 1A). This observation window of 1 year has shown to result in high accuracy,21 while the prediction window (1 year before the diagnosis) of 1 year ensures the possibility to start prevention in an early stage.

(A) Data are collected −2 to −1 year before the diagnosis by the general practitioner. (B) For this example, the data contain four different codes. N bins of equal width in time are created. Codes are divided into these bins. (C) Sequential information (length 1, 2 or 3) is extracted from the bins and the corresponding codes. Codes in the same bin are indicated as co-occurrent (+), while codes in different bins are following upon each other (−>). All possible combinations with these four codes are shown in C.
Dataset creation
Two separate datasets were created: a non-sequential and a sequential dataset. The non-sequential dataset described whether a health complaint (ICPC code), chronic disease (an episode with an ICPC code), a prescription (ATC code) or diagnostic code (NHG code) was present in the selected interval. Therefore, no time-dependent information is included. The sequential dataset was designed to include time-dependent information in and between the ICPC, chronic ICPC, ATC and diagnostic codes in the form of upon each other following codes (eg, myocardial infarction followed by beta-blocking medication). An overview of the calculation of sequential data is given in figure 1. These codes define a sequence, hence the name sequential dataset. The datasets differed on the included variables but contained the same patients. The datasets were used to predict the extracted target variable HF.
Non-sequential dataset
For each code except chronic ICPC, it was checked whether the starting date of the code fell into the selected interval. For chronic ICPC, it was checked if the starting date was before the end of the interval. If these conditions were satisfied, the corresponding ICPC code, chronic ICPC code, ATC code or diagnostic code variable was set to the value ‘1’. As additional variables, the presence of a visit 0 up to but not including 1 month, 1–2 months, 2–3 months and 3–12 months before the end of the selected interval is added. Variables which were present both in less than 5% of the patients and in less than 5% of the controls were removed, because the inclusion of too many variables leads to overfitting, which decreases performance of the model on a new dataset.22 In the created dataset, each row represents a patient and each column a variable, with the cell value (1 or 0) indicating whether that variable was present for that patient in the interval.
Sequential dataset
To include sequence information in and between the ICPC, chronic ICPC, ATC and diagnostic codes, both the code and the date of the code were taken into account. Furthermore, additional preprocessing was necessary.
Additional preprocessing
For the sequential dataset, chronic ICPC codes, ATC codes and diagnostic codes were additionally preprocessed. The date of chronic ICPC codes was set to the start of the selected interval (as the code occurred prior to the first date in the interval). Temporal information among chronic codes was not taken into account. ATC codes which occurred at least three times 180 days before to 90 days after the start of the interval were interpreted as chronic medication, which is commonly repeated every 90 days, and included only once with the date corresponding to the start of the selected interval. For diagnostic codes, only numerical and categorical codes and corresponding values were taken into account. Numerical codes without a numerical value (eg, free text, signs, ranges or no value) were excluded. For categorical codes, we included each value per code as a separate variable since the value is not ordinal and thus hampering linear models, for example, 1739_1, 1739_3 and 1739_4 is yes, no and previously on the question if the patient is smoking, respectively. The numerical value of a laboratory measurement should be related to a reference value to make sense, that is, to identify if a measured value is too high, normal or too low. In this study, each numerical value is compared with the previous numerical value for the same diagnostic code in the patient, indicating an increased, decreased or stable (with an allowed level of fluctuation) measurement with regard to the previous measurement (code+‘_up’, ‘_down’ or ‘_norm’), creating three possible options. The first value was compared with the mean of the population in a similar manner since no previous measurement was available.
The list of codes per patient was ordered according to date. The time interval was subsequently binned in 12 bins of equal width, corresponding to a bin width of 1 month (figure 1B). The date of each code was set according to the first date of the bin they occupied and each code was included only once in a bin. This ensures that (1) equal codes in a small region of time were not repeated, and (2) different codes which were correlated with the same problem but not measured on the same date (eg, diagnostic codes after ICPC codes) were set to the same day. The duration of each code was set to a single day, since no accurate information on true duration was known.
Sequence calculation
Sequences are defined as the occurrence of an event in a bin with a different event in the same bin (co-occurrence) or with an event in a bin later in time (figure 1C). Since nearly infinite number of sequences can be present, leading to a high number of rare sequences without added value, decreased generalisability and computational inefficiency, it is necessary to be selective, that is, only select sequences which were present in a certain threshold (here 10% due to a high increase of features and cost of time at lower levels) of cases or controls. The length of a sequence varies in this study from one event (ie, hypertension) to three events (ie, hypertension followed by antithrombotic agents together with diuretics). It has to be noted that the duration of a code (ie, how long a patient has a complaint) is set to 1 day, as the true duration is unknown. Therefore, it is not possible to find an ongoing code during which another code starts (co-occurrence). Co-occurrence in this study indicates that both codes start at the same time (or the same bin). Since chronic ICPC and ATC codes are set to the first available date, co-occurrence with these chronic codes during the rest of the period is not possible. This is done to ensure the sequences indicate new information: if a certain ICPC code or medication code is present, it is not just a regular medication or check-up for a chronic disease, which may limit the information in sequences, but something new the patient visits the GP for. A more detailed explanation on the calculation of sequences can be found from Kop et al and Batal et al.15 16 The implementation of the algorithm used in our study is based on scripts provided by Kop et al.15 Pattern identification resulted in a table similar to the non-sequential dataset, but instead of the presence of a code, each column indicates the presence of a pattern.
Learning subsets
Six subsets were created which allow for the evaluation of specific variable groups (demographics, non-sequential and sequential). The following six subsets were defined for training of the algorithm (table 1):
Demographic data: in this subset, only age and gender were included as variables, since it is expected that these variables contribute significantly to the prediction.
Non-sequential data: this subset includes the variables as described in the non-sequential dataset, as well as information if the patient had contact with the GP 0–1, 1–2, 2–3 or 3–12 months before the end of the data collection (yes/no). Age and gender are not included.
Extended non-sequential data: this subset combines demographic data and non-sequential data from subsets 1 and 2.
Sequential data: this subset includes the sequence variables as well as information if the patient had contact with the GP 0–1, 1–2, 2–3 or 3–12 months before the end of the data collection (yes/no). Age and gender are not included.
Extended sequential data: this subset includes sequential data and demographic data from subsets 1 and 4 combined.
Complete data: this subset includes demographic data, non-sequential data and sequential data from subsets 1, 2 and 4. Variables which were present multiple times were only taken into account once.
Variables included in each dataset
Model development
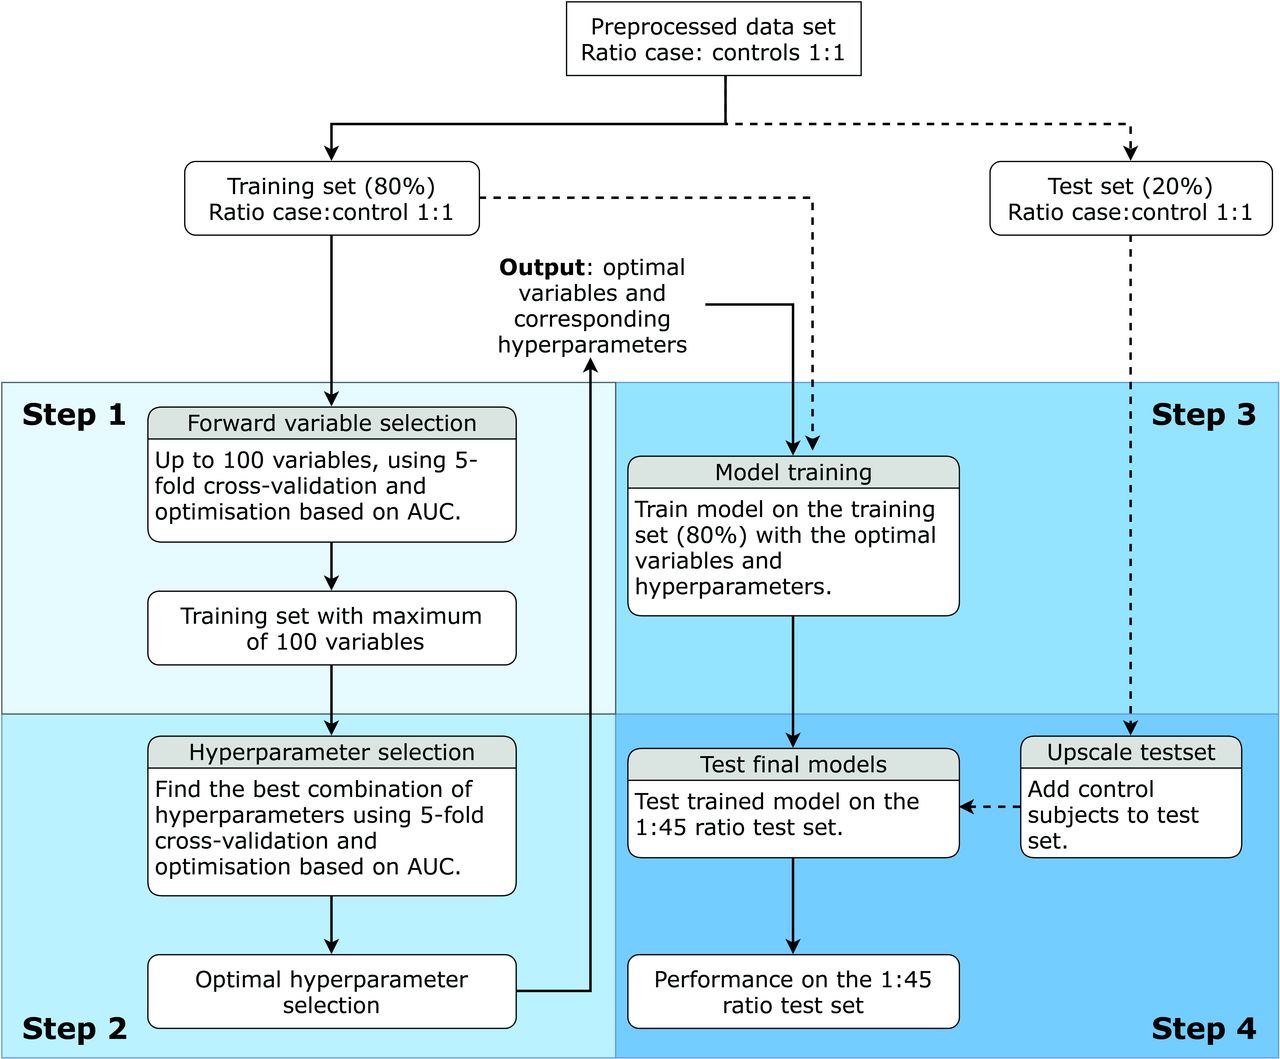
The model was trained according to the method in figure 2 for each of the six described subsets. Furthermore, the model was trained using a logistic regression, a random forest23 and an XGBoost algorithm,24 since these algorithms are known to be able to provide good results.25 Data were divided once into a stratified 80% training set and a 20% test set. The selected patients and controls in the train and test set were the same for each dataset. Per algorithm, subsequently variable selection (step 1), hyperparameter optimisation (step 2), model training on the training set (step 3) and model testing on the test set (step 4) were performed. A plot indicating the number of patients screened versus the number of correctly identified patients is used for clinical evaluation per algorithm and per dataset. Furthermore, a receiver operator characteristics (ROC) curve indicates optimal model performance, while the confusion matrix and sensitivity, specificity and accuracy at the Youden index (the best combination of sensitivity and specificity) are provided for further inspection of each model.

Flow chart of the algorithm for variable selection, hyperparameter optimisation and model training and testing. From preprocessing, the bold lines are to be followed, while the dotted lines indicate data to be used. The four steps are indicated separately. This flow chart is followed for each algorithm on each dataset. AUC, area under the curve.
Step 1: variable selection
Variable selection was performed on the training set using a greedy forward variable selection (FFS) algorithm with internal fivefold stratified cross-validation. FFS tests the performance of the algorithm with every single variable, of which the best is included. Subsequently, the performance of the best variable in addition to the selected variable is selected and repeated, until the performance does not improve further, resulting in the optimal variable set.26 The algorithm used was the same as the algorithm to be used in hyperparameter optimisation and model training, although default hyperparameter settings were used for each algorithm (online supplemental appendix A, table A1). The area under the curve (AUC) score was used as the performance metric. A maximum of 100 variables could be selected, as it was found performance did not increase with higher numbers of variables. All variables were scaled to mean zero with unit variance (known as the z-score) for the whole dataset. This prevents the range of a parameter to influence the algorithm. As the currently used algorithms are relatively robust to this, it is especially important for future algorithms which may be used on the current data.
Supplemental material
Step 2: hyperparameter optimisation
After variable selection, the optimal hyperparameters for the selected algorithm with the optimal number of variables were selected. Variable selection itself does not depend on the hyperparameter selection process. Selection of the optimal hyperparameters lets the algorithm perform better on the available dataset. To this end, a grid search (evaluation of the performance using every combination of hyperparameters) was performed for each combination of preselected hyperparameter configurations (online supplemental appendix A, table A2), using fivefold stratified cross-validation with optimisation based on the AUC. Scaling to zero mean and unit variance was performed each time on the training folds and applied to the test fold to prevent data leakage between training and testing folds.
Step 3: model training
After hyperparameter optimisation, the optimal variables combined with the optimal hyperparameters for these variables were known. The model was trained on the full training set with scaling to zero mean and unit variance. The prediction model was trained on a dataset with a 1:1 ratio of cases:controls, as a severely non-balanced ratio may push the algorithm to a prediction biased towards the dominant class.
Step 4: model testing
To investigate the performance of the model in a true clinical population, we added control subjects to the test set to obtain a ratio of 1:45 cases to controls corresponding to the true incidence of the selected population. The additional controls were randomly selected without matching for GP but with a minimum age of 70 and preprocessed in a similar manner to the original controls. The variables identified for the 1:1 ratio for both the non-sequential and the sequential datasets were selected. Scaling was performed according to the scaling obtained during model training. The trained model was used to test the performance of this upscaled test set. Significance was tested between ROC curves using a script by Kazeev with an implementation of the method of Sun and Xu.27 28
Results
Demographics
In total, 25 939 unique patients had a first diagnosis of HF between 2014 (first date on which HF could be present with 2 years of preceding data) and 2019. Of these 25 939 patients, 12 068 patients had 3 years of consecutive data registered correctly by the GP, as indicated by the exclusion criteria. Of these 12 068 patients, 8543 patients had the needed time period (2 years) of data before diagnosis. Therefore, a total of 8543 patients and 8543 controls were included in the 1:1 ratio dataset. Patient characteristics are given in table 2. The test set consisted of 20% of the dataset, which is 1709 patients and 1709 controls. An additional 75 196 unique controls were included in the 1:45 ratio test dataset. The non-sequential dataset initially consisted of 2245 variables, of which 1966 variables were removed as they were not present in 5% of the cases or controls. The final six datasets consisted of 2, 279, 281, 1193, 1195 and 1407 variables, respectively. A total of 171 (2.00%) patients and 417 (4.88%) controls did not visit the GP (no ICPC code present) in the selected time period. In the non-sequential dataset, 4 variables described the number of ICPC codes in the selected time period, 58 variables were chronic ICPC codes, 36 were symptom ICPC codes, 147 were diagnostic codes and 34 were ATC codes. In the sequential dataset, 136 sequences consisted of one variable, 604 of two variables and 449 of three variables. Four variables described the number of ICPC codes in the selected time period. Of the 136 sequences consisting of one variable, 30 sequences contained chronic ICPC codes, 8 contained symptom ICPC codes, 73 contained diagnostic codes and 25 contained ATC codes. Of the original 17 086 patients, BNP measurements were performed in 1018 (6.0%) patients, of which 724 (8.5%) cases and 294 (3.4%) controls. These BNP measurements are done in the evaluated time period, that is, −2 to −1 year before the diagnosis of HF. Therefore, the number of measurements is lower than expected when used for diagnosis of HF in the Dutch GP care.
Patient characteristics
Model performance
The used hyperparameters for the FFS algorithm are given in online supplemental appendix A, table A1. A full list of searched and selected hyperparameters for each algorithm and each dataset is given in online supplemental appendix A, table A2. The variables selected per step in the FFS algorithm for the extended non-sequential dataset and the complete dataset combined with the logistic regression algorithm are given in online supplemental appendix A, table A3. Only the combination of these datasets and algorithms is shown, as these resulted in the highest predictive performance.
Model performance is assessed on the 1:45 ratio test set (table 3 and figure 3). Figure 3A only shows the logistic regression model, as this was the best performing model. For both ratios, a clear increase in the area under the ROC curve was seen for the extended non-sequential dataset compared with the demographic or the non-sequential dataset. The sequential dataset as well as the extended sequential dataset improved the AUC over the demographic dataset. Combining all data in the complete dataset did not improve performance further. For almost all datasets, the logistic regression algorithm performed best. Confusion matrices for the best performing models are provided in online supplemental appendix B, table B1-B3.
Supplemental material

Receiver operator characteristics curve (A) and correct diagnoses versus number needed to screen (B) for the logistic regression model using the demographic, extended non-sequential and complete dataset with a 1:45 ratio. AUC, area under the curve.
Performance on the test set with ratio 1:45 per algorithm per dataset
In the GP setting, the ‘optimal’ performance is ambiguous; the goal is to identify as many patients as possible, but without too many false positives, which would lead to alarm fatigue, unnecessary testing and overtreatment. Therefore, although accuracy, sensitivity, specificity and confusion matrices are provided at the highest Youden index, the performances are additionally provided in a plot of correct diagnoses versus number needed to screen (figure 3B) and the number of needed to screen when 10% of the cases are aimed to find (table 4).
Number of patients identified as cases (both true and false positives) and the number of false positives called up for the detection of a single case if 10% of the cases are to be found in the 1:45 ratio set (true incidence)
Variable importance
The variable importance for the logistic regression model on the extended non-sequential dataset and the complete dataset is shown in figure 4. It has to be noted that due to interactions, the variable importance only shows an indication. As expected, age is the most important variable for the prediction of HF for both the extended non-sequential dataset as the complete dataset. For both datasets, multiple important variables can be related to the physiology of HF or known risk factors, such as a myocardial infarction, atrial fibrillation, presence of diabetes mellitus type 2 and smoking. Several variables tend to show a conflicting weight, that is, the presence of ankle oedema reduces the chance of HF, while it is a known risk factor. This is due to the nature of the model and possible correlation between variables, and as shown in online supplemental appendix C, tables C1 and C2, with the correlation coefficient, a negative weight is often not accompanied with a negative correlation coefficient. Furthermore, several variables show which are hard to explain, such as arthrosis of the knee or sexual dysfunction. Possible reasons may be the interactions between variables, indicating that variables actually represent a different disease. Furthermore, the presence of a variable may in some cases trigger investigation of HF, such that it will only be predictive in this setup closer to the HF diagnosis.
Supplemental material

Variable importance of the 20 most important variables using the logistic regression algorithm for the extended non-sequential dataset (A) and the complete dataset (B). BP, blood pressure; DM, diabetes mellitus; GP, general oractitioner; HDL, high-density lipoprotein; LDL, low-density lipoprotein; RAAS, renin-angiotensin-aldosterone system.
Discussion
This study aimed to develop a model able to predict HF 1 year before diagnosis registered by the GP based on GP data collected over the previous year. As expected, age was an important variable, resulting in the finding that the models using the demographic dataset achieved an adequate AUC while not being very specific. The addition of non-sequential variables improved performance significantly without overlapping 95% CI of the AUCs and increased the specificity of the model to a level in which it can be interesting for risk assessment in the population of the GP practice. Adding sequential variables to the (extended) non-sequential model resulted in a slightly lower performance as measured by the AUC. The 95% CIs of the AUC curves of the extended non-sequential and the complete dataset show a large overlap without a significant difference. Interestingly, while the AUC was not the highest, the logistic regression algorithm on the complete dataset had the fewest false positives when aiming to find 10% of the cases.
Sequential variables did not improve the prediction. Comparing the performance of the extended non-sequential dataset with the extended sequential dataset, the extended sequential dataset resulted in a lower AUC although with overlapping CI, even though the majority of the variables present in the extended non-sequential dataset were also present in the extended sequential dataset by design (sequence codes with a length of one can be seen as non-sequential codes indicating presence of a code). Furthermore, the addition of sequences to the extended non-sequential dataset did not result in an increase in the performance. A possible explanation could be that sequential data are build up from non-sequential information, and therefore partly incorporate the same information. Sequential data may therefore add limited information compared with the number of variables introduced. However, other studies using sequential data found that temporal sequences increased prediction accuracy.15 16 Yet, the variables used were also correlated, as they were for instance repetitions of one code.15 Therefore, we expect that this approach will have additional value in some problems, while it has lower additional value in other problems such as studied here. Furthermore, it has to be noted that (1) co-occurrence was not precisely the same due to data limitations and (2) the percentage for cases or controls in which the sequence should be present differed. These differences may alter the effect of sequence incorporation.
Since diagnosis by the GP is the current standard, each true positive-identified patient is identified 1 year earlier than normal. Before actual implementation, further development of the model is necessary. There are important considerations to address during further development and implementation. First, the number of false positives: screening of the whole population would result in a large number of false positives, resulting in both overtesting in the GP and subsequent patient stress, which is already present in GP care.29–31 Subsequently, clinicians may experience alarm fatigue, resulting in reduced sensitivity for alarms.32 In this study, the false-positive rate is reduced by identifying the patients of which the model is most confident: correctly identifying 170 patients (±10%) corresponds to a total of 1189 patients classified positive, of which 1019 incorrect (5.99 false positives per case, table 4). This means that if a single GP practice has 20 cases of HF per year, identifying 2 cases a year earlier with subsequent early intervention results in 12 patients being identified as false positives. All 14 patients will be identified as at risk. In a future model setting, we envision that at-risk patients can be followed up by the GP to further reduce the false-positive rate. Second, the follow-up performed: the model may give the GP an indication that the patient is at risk of future development of HF. The GP can subsequently decide to do further testing with a non-invasive and time-effective method such as an ECG or laboratory measurement (such as BNP levels, which have a high diagnostic value),7 33 which may enable further narrowing down the set of patients. If more at risk, an echo can be performed, which indicates severity and may help for further prognostication.34 The best steps in the follow-up will depend on future research but also on clinical preference, time needed and patient impact. A higher number of patients in which the GP performs follow-up may result in earlier identification in more patients. At the same time, follow-up and testing may cause among others an increased amount of stress, in which a balance has to be found.
After further development of the model, for instance, by using more complex learning algorithms, the value of traditional measures such as BNP in patients selected by the developed model should be evaluated. Afterwards, the efficacy of the model and experience of the clinician combined should be compared against the current standard, which is the clinician itself. Care should be given to keep incorporating the skill and experience of clinicians by adding value to these factors, instead of replacing them with the model prediction. Furthermore, although early intervention at high-risk patients did show a reduced development of HF,6 the effect of early diagnosis and sequential intervention as proposed still has to been studied. Given a positive effect, the model may be implemented in the general GP system, directly showing whether the patient is at risk of HF development per patient if asked. It has to be noted that the model is developed using the electronic files of Dutch GP practices, and therefore is currently focused on implementation in the Dutch healthcare system. If such an approach works, this may be expanded using local data sources. Similar models may be developed for different diseases,15 35 which can lead to an overload of alarms for the GP. Ideally, to prevent this, multiple models should be combined in a single dashboard. This dashboard could be implemented in the GP systems, reducing the need to use a standalone tool. It is recommended that a standardised roadmap be used for the development of such a multitude of tools for implementation in the clinic.36
Compared with earlier studies, performance seems to be similar. However, to the best of our knowledge, none of the earlier studies evaluated the accuracy of the model on the true incidence and used controls without age and gender matching, even though these are important variables. Therefore, the current study shows for the first time the performance of a prediction model for HF based on GP data comparable with daily clinical practice. Compared with studies which predicted HF at varying times before diagnosis using logistic regression and random forests, the current study had a similar to a better AUC,21 37 with the notion that the data in these studies were not precisely the same and that age and gender were not used. The same data examined with recurrent neural networks improved performance slightly.38 Interestingly, these studies showed that increasing the observation window to 2–3 years can further increase the performance, which can be taken into account in future research. Other studies using recurrent neural networks and a derived algorithm did result in high AUCs (up to 0.883),13 14 39 but used data leading up to the moment of diagnosis, which effectively removes the potential health gained by earlier prediction. However, a constant in these studies is the better performance from a recurrent neural network than a logistic regression model. Therefore, it would be interesting to implement a recurrent neural network to evaluate if this further improves performance, since it does not always outperform the temporal patterns used in this study.40
This study has some limitations. First, the duration of a code is unknown (ie, how long a symptom as stated by an ICPC code continues), and thus set to 1 day. Therefore, sequences indicating co-occurrence of codes indicate that codes start in the same bin, instead of, for example, an ongoing code with a new code starting halfway. Future research should examine the effect of the use of a standard duration per code. Second, since related codes may occur close to each other, codes are grouped per month. However, if related codes happen on the border of a month, codes may be grouped in separate months. Although presumably a small effect, future algorithms may benefit from a soft border.41 Third, the included algorithms, especially logistic regression, are fairly basic. More complex algorithms, including deep neural networks able to capture temporal patterns, may improve prediction accuracy.13 It has to be noted that this may come at the cost of less insight in the algorithm. Fourth, although the sequences included temporal aspects, it did not include the duration between codes, meaning it did not matter if a sequence occurred in, example given, a timespan of 2 months or 8 months. Furthermore, it did not matter if the sequence occurred early or later on in the data. Therefore, corrections for these aspects may improve performance with the sequences used. Fifth, a high correlation between the parameters exists. Therefore, although it does give an indication what important parameters are, the interpretability of the model is limited. This is seen in figure 4 and online supplemental appendix C, tables C1 and C2, where findings sometimes contrast logic. Lastly, although the prediction task at hand may be difficult, the model performance is currently not yet good enough for clinical implementation and should be improved further. Furthermore, and this may be the most important limitation before implementation, the current model performance is based on internal cross-validation. Although it is not expected due to the characteristics of the dataset that the performance will drop substantially, an external validation cohort is needed to validate this hypothesis.
Conclusion
This study created a model which was able to identify patients with pending HF a year before the diagnosis occurred by the GP. Furthermore, the current study used for the first time true incidence rates for the evaluation of the model performance. Information on the presence of health complaints, medication and diagnostic codes contained important information, while sequential information did not significantly improve performance. We recommend further improving predictive performance and subsequent validation in an external cohort before moving to testing the model in the GP office for recognising pending HF.
Data availability statement
No data are available. The scripts, but not the data itself, are shared.
Ethics statements
Patient consent for publication
Ethics approval
Dutch legislation indicates that informed consent or medical ethical committee approval is not needed for the current observational study. It is mandatory for GPs in the Nivel-PCD to inform their patients about participation in and the option to opt out of the Nivel-PCD. This study has been approved according to the governance code of Nivel-PCD under no. NZR-003.20.074.
Acknowledgments
We thank Marianne Heins for help with the extraction of data from the NZR database. Furthermore, we thank Mark Nielen and Daan van Kooten for quality and privacy checks on the script.
References
Supplementary materials
Supplementary Data
This web only file has been produced by the BMJ Publishing Group from an electronic file supplied by the author(s) and has not been edited for content.
Footnotes
Contributors The study was designed by FCB, JCK, CA and MH. Analysis of the data was performed by FCB. Interpretation was done by FCB, JCK, CA and MH. Drafting of the article was performed by FCB. Critical revision of the article was performed by FCB, JCK, CA and MH. Final approval of the version to be published was given by all authors. FCB acts as guarantor for this study.
Funding FCB was partly supported by the Netherlands Cardiovascular Research Initiative (CVON) (CVON2017-15 RESCUED) for a different, but related project. This research itself received no specific grant from any funding agency in the public, commercial or not-for-profit sectors.
Competing interests None declared.
Patient and public involvement Patients and/or the public were not involved in the design, or conduct, or reporting, or dissemination plans of this research.
Provenance and peer review Not commissioned; externally peer reviewed.
Supplemental material This content has been supplied by the author(s). It has not been vetted by BMJ Publishing Group Limited (BMJ) and may not have been peer-reviewed. Any opinions or recommendations discussed are solely those of the author(s) and are not endorsed by BMJ. BMJ disclaims all liability and responsibility arising from any reliance placed on the content. Where the content includes any translated material, BMJ does not warrant the accuracy and reliability of the translations (including but not limited to local regulations, clinical guidelines, terminology, drug names and drug dosages), and is not responsible for any error and/or omissions arising from translation and adaptation or otherwise.