Article Text

Abstract
Objectives The fragmentation of the response to the COVID-19 pandemic at national, regional and local levels is a possible source of variability in the impact of the pandemic on society. This study aims to assess how much of this variability affected the burden of COVID-19, measured in terms of all-cause 2020 excess mortality.
Design Ecological retrospective study.
Setting Lombardy region of Italy, 2015–2020.
Outcome measures We evaluated the relationship between the intensity of the epidemics and excess mortality, assessing the heterogeneity of this relationship across the 91 districts after adjusting for relevant confounders.
Results The epidemic intensity was quantified as the COVID-19 hospitalisations per 1000 inhabitants. Five confounders were identified through a directed acyclic graph: age distribution, population density, pro-capita gross domestic product, restriction policy and population mobility.
Analyses were based on a negative binomial regression model with district-specific random effects. We found a strong, positive association between COVID-19 hospitalisations and 2020 excess mortality (p<0.001), estimating that an increase of one hospitalised COVID-19 patient per 1000 inhabitants resulted in a 15.5% increase in excess mortality. After adjusting for confounders, no district differed in terms of COVID-19-unrelated excess mortality from the average district. Minimal heterogeneity emerged in the district-specific relationships between COVID-19 hospitalisations and excess mortality (6 confidence intervals out of 91 did not cover the null value).
Conclusions The homogeneous effect of the COVID-19 spread on the excess mortality in the Lombardy districts suggests that, despite the unprecedented conditions, the pandemic reactions did not result in health disparities in the region.
- COVID-19
- INFECTIOUS DISEASES
- PUBLIC HEALTH
Data availability statement
No data are available. We do not have the right to distribute the analysed data (owned and provided by the Lombardy Region).
This is an open access article distributed in accordance with the Creative Commons Attribution Non Commercial (CC BY-NC 4.0) license, which permits others to distribute, remix, adapt, build upon this work non-commercially, and license their derivative works on different terms, provided the original work is properly cited, appropriate credit is given, any changes made indicated, and the use is non-commercial. See: http://creativecommons.org/licenses/by-nc/4.0/.
Statistics from Altmetric.com
STRENGTHS AND LIMITATIONS OF THIS STUDY
We leveraged a wide set of population characteristics, including real-world data on all the COVID-19 hospitalisations in the region, to explain the observed heterogeneity of excess mortality in the most populous Italian region.
Over the year 2020, the official counts of infections were not an accurate measure of the spread of SARS-Cov-2 in the population because of the insufficient test availability throughout the year. We used the COVID-19 hospitalisations as a proxy of the spread of the virus.
Our study only addresses the immediate excess mortality observed in 2020. Future work should focus on the long-term effects of the pandemic.
Introduction
Since the start of the COVID-19 pandemic, many different actions have been undertaken worldwide to fight the direct and indirect consequences of the disease. Although many of these actions have been implemented at the national level, a plethora of measures have been taken locally by provinces, cities, healthcare systems and individual hospitals. Such measures included decisions of municipal public health authorities on restrictive measures and bans, advertising campaigns, revolutions in hospital management and drastic reorganisations of the emergency medical services. Notably, the implementation of these actions has been affected by contextual circumstances, such as the sudden increase in infection incidence, the capacity of decision-makers, the resilience of physicians and nurses and the citizens’ compliance. All these factors contributed to the fragmentation of the response and may represent a source of heterogeneity for the effectiveness of the actions on the quality of the healthcare provided. In this context, understanding what has made a difference in mitigating the effects of COVID-19 is essential to improve future preparedness for similar crises. In this study, we aimed to evaluate how much of this variability affected the containment of the burden of the COVID-19 epidemic. We focused on Lombardy, the Italian Region that was first and most affected by the SARS-CoV-2 pandemic.1
The easiest way to appraise the cumulative burden of the COVID-19 pandemic is by counting the number of people who died as a consequence of the disease.1–4 However, it has become clear that the COVID-19 toll has been far heavier than the deaths directly caused by (or attributed to) the disease. Social and economic recession due to restrictive national policies,5–9 interruption of routine screening programmes,10–14 lack of resources usually allocated to out-of-hospital healthcare, shortage of hospital beds and many other consequences of the pandemic have taken their tribute in terms of avoidable deaths.15–17 In Lombardy, out of a population of around 10 million inhabitants, 4 78 903 patients were infected in 2020, and 25 123 died of COVID-19.1 This amount, however, only accounts for 69% of the overall excess mortality, as emerged by comparing the total number of deaths in 2020 (136 249) to the mean of the five previous years (99 749.4), as registered by the Italian National Institute of Statistic (ISTAT).18 Therefore, it has been recommended to consider the overall excess of mortality, computed by comparing actual data to the prepandemic period, to assess the true burden of COVID-19.19 20
Several studies have been dedicated to the accurate estimation of the mortality excess and its comparison across countries or regions,21–26 both overall and in strata of the population (primarily sex and age group), with most of them presenting estimates for the Lombardy region or smaller areas therein.22–26 Other studies have focused on the contribution of specific variables to the differences in excess mortality observed over geographical areas,27 28 such as air pollutants, meteorological factors, availability of healthcare resources, demographic variables and socioeconomic characteristics. However, to the best of our knowledge, no previous study aimed at assessing the heterogeneity of the relationship between the intensity of the SARS-COV-2 epidemic and the overall excess mortality to understand if the local response to the pandemic impacted the excess mortality, after adjusting for the possible differences in the spread of SARS-COV-2 in the studied area. With the present analysis, we fill this gap by studying such a relationship in Lombardy and evaluating whether we observed differences over the territory as a result of local resilience.
Material and methods
Study design and data collection
This study is part of the Tsunami project, funded by the Lombardy Region to evaluate the consequences of COVID-19 on the regional emergency system.
To study the impact of the pandemic at the local level, we considered the healthcare and social district as the geographical unit of reference. This is the smallest official unit identified by the Lombardy Region as composed of a group of adjacent municipalities sharing common public services (eg, healthcare facilities or places of education). There are 91 districts in Lombardy.
Our primary outcome was the overall excess mortality, computed for each district as the ratio between the deaths that occurred in 2020 among the residents and the average annual deaths recorded from 2015 to 2019. The yearly deaths were retrieved from the ISTAT public database.29
The exposure of interest was the spread of the pandemic within the districts. We could not represent this phenomenon with the official counts of infections, because of the substantial difference in SARS-CoV-2 test availability throughout the year. Hence, we used the percentage of the residents in the districts hospitalised with COVID-19, being this much more consistent and highly correlated to the true prevalence of the disease. The Lombardy Region provided these data.
To identify the relevant confounders of the relationship between overall excess mortality and the spread of the pandemics, we represented the causal network underlying the direct and indirect effects through a directed acyclic graph (DAG). These graphs are well-established tools to outline potential confounders and identify the factors that must be taken into account in adjusted analyses.30 31 The DAG was developed by a multidisciplinary team of ED doctors, epidemiologists and statisticians, following a Delphi-modified consensus process. Further details are provided in online supplemental material.
Supplemental material
The DAG representation suggested that five district-level variables could act as confounders in our study: age distribution, population density, pro-capita gross domestic product (GDP), restriction policies and mobility of people. Population characteristics of each district were collected from the ISTAT archive.29 Data regarding pro-capita GDP were collected from the data repository curated by the Lombardy Region, updated to 2016.32 We considered six periods, corresponding to different restriction policies implemented in Lombardy: (1) pre-COVID-19 (P1), from 1 January to 8 March, when no restrictive measure was put in place at the regional level; (2) first wave, hard lockdown (P2), from 9 March to 2 May, when all retail stores were closed, except for those providing basic needs, and a stay-at-home order was imposed; (3) first wave, soft lockdown (P3), from 3 May to 13 June, when the stay-at-home order was lifted and retailers were allowed to open with strong restrictions (eg, bars and restaurants could only sell goods with takeout or delivery orders); (4) summer, no lockdown (P4), from 14 June to 13 September, when most restrictions were lifted; (5) resumption of activities, no lockdown (P5), from 14 September to 5 November, when school started and most jobs resumed in-person activities and (6) second wave, hard lockdown (P6), from 6 November to the end of the year, when a new stay-at-home order and stringent restrictive measures were issued.33 As a proxy of people’s mobility, we used data provided by the largest Italian phone carrier (TIM) regarding movements of mobile phones in 2020, aggregated at the province level. These data log each time a mobile phone switches from one radio cell to another. We used the ratio between the observed movements in each study period and the corresponding value observed during the P1 period. Notably, provinces in Lombardy (12 in total) represent greater areas than districts, so that we attributed the same mobility value to all districts belonging to the same province.
Statistical analysis
Counts and proportions were used as descriptive statistics for categorical variables, median and IQR for ordinal and continuous variables, and mean and SD for continuous variables; appropriate 95% CIs were computed for each estimate of interest.
To model the overall excess mortality of the 91 districts over the 2020 periods, we developed a multivariable negative binomial regression model. We opted for a negative binomial distribution to account for the overdispersion of the response variable, observed in preliminary exploratory data analyses. We considered the count of 2020 deaths as the response, while we included the logarithm of the expected deaths (ie, the average number of deaths observed in the district in 2015–2019) as an offset, so that the coefficients of the predictors measured the effect of the corresponding variable on excess mortality. The five identified potential confounders were forced into the model, together with our exposure of interest (percentage of COVID-19 hospitalised patients). Concerning the age distribution of the district, we considered the percentage of the population older than 65 years old.
To account for the possible correlation of the excess mortality along the time periods of the same districts and to model the residual district-level heterogeneity, we added two district-specific random effects to the model, one on the intercept and one on the coefficient of the percentage of COVID-19 hospitalised patients.
We performed different analyses to verify the adequateness of the model’s assumptions. First, our negative binomial regression model assumed a linear relationship between the quantitative variables and the logarithm of the excess mortality. To verify this assumption, we fit a generalised additive model (GAM) with the same predictors considered and evaluated whether a non-linear relationship emerged from the estimated smooth functions. By flexibly modelling the association between covariates and outcomes, GAMs enable the detection of the correct transformation of the quantitative variables included in the model.34 Second, to verify whether assumptions about the mean and variance of the response were violated, we graphically inspected the residuals of the model, plotting them against predicted values and quantitative covariates. Third, we verified whether the distributional assumption of the response was adequate by testing whether a simpler Poisson distribution instead of the negative binomial distribution could be assumed.
Data were analysed using R, V.4.1.0.35
Patient and public involvement
None.
Results
About 36 500 more deaths were registered in Lombardy in 2020 compared with the annual mean number of deaths in 2015–2019. Tables 1 and 2 present the fixed and time-dependent characteristics of the population.
Demographic characteristics of the districts in Lombardy
Description of the districts with respect to the time-dependent variables
We observed a similar age distribution across the districts, with about 45% of the inhabitants being 50 years old or older.36 Conversely, high heterogeneity of densities was observed across districts, reflecting the coexistence of metropolitan, rural and mountain areas in Lombardy. We calculated that 48% of the population lives in high-density areas with more than 1000 inhabitants/km2. Between-district heterogeneity in pro-capita GDP was also observed, with most districts being in the range between 20 000 and 25 000 euros per year.
As expected, mobility reached its minimum value during the first lockdown period (P2). The number of movements rapidly increased soon after the restriction policies were loosened. Within periods, we observed large between-province differences, which can be explained by the inhomogeneity of the territories in terms of population density.
Concerning excess mortality, two peaks associated with the major pandemic waves (P2 and P6) clearly emerged. We observed a greater excess mortality and a much wider variability among districts in the first wave. Specifically, in P2, the median excess mortality across the districts was 2.44 (ie, the 2020 deaths were about two times and a half the average of the yearly deaths in 2015–2019), while the first and third quartiles were 1.85 and 3.49. The excess mortality was more uniform during the second wave (P6, median excess mortality: 1.47, Q1–Q3: 1.18–1.72).
The results of the multivariable model are presented in table 3. As expected, the number of COVID-19 hospitalised patients was positively associated with the 2020 excess mortality (p<0.001), with a rate ratio (RR) of 1.155 (95% CI 1.133 to 1.176), meaning that an increase of one hospitalised COVID-19 patient per 1000 inhabitants was associated to an increase of 15.5% of the excess mortality, after adjusting for the other covariates. Regarding the independent effect of the periods representing the different restriction policies, all except P5 were significantly associated with excess mortality. Compared with P1, P2 was characterised by a 77% higher excess mortality (RR 1.768, 95% CI 1.565 to 1.998), while it was 10% higher in P3, P4 and P6. The coefficients of all the other variables were not significantly different from zero.
Estimates of the negative binomial regression model
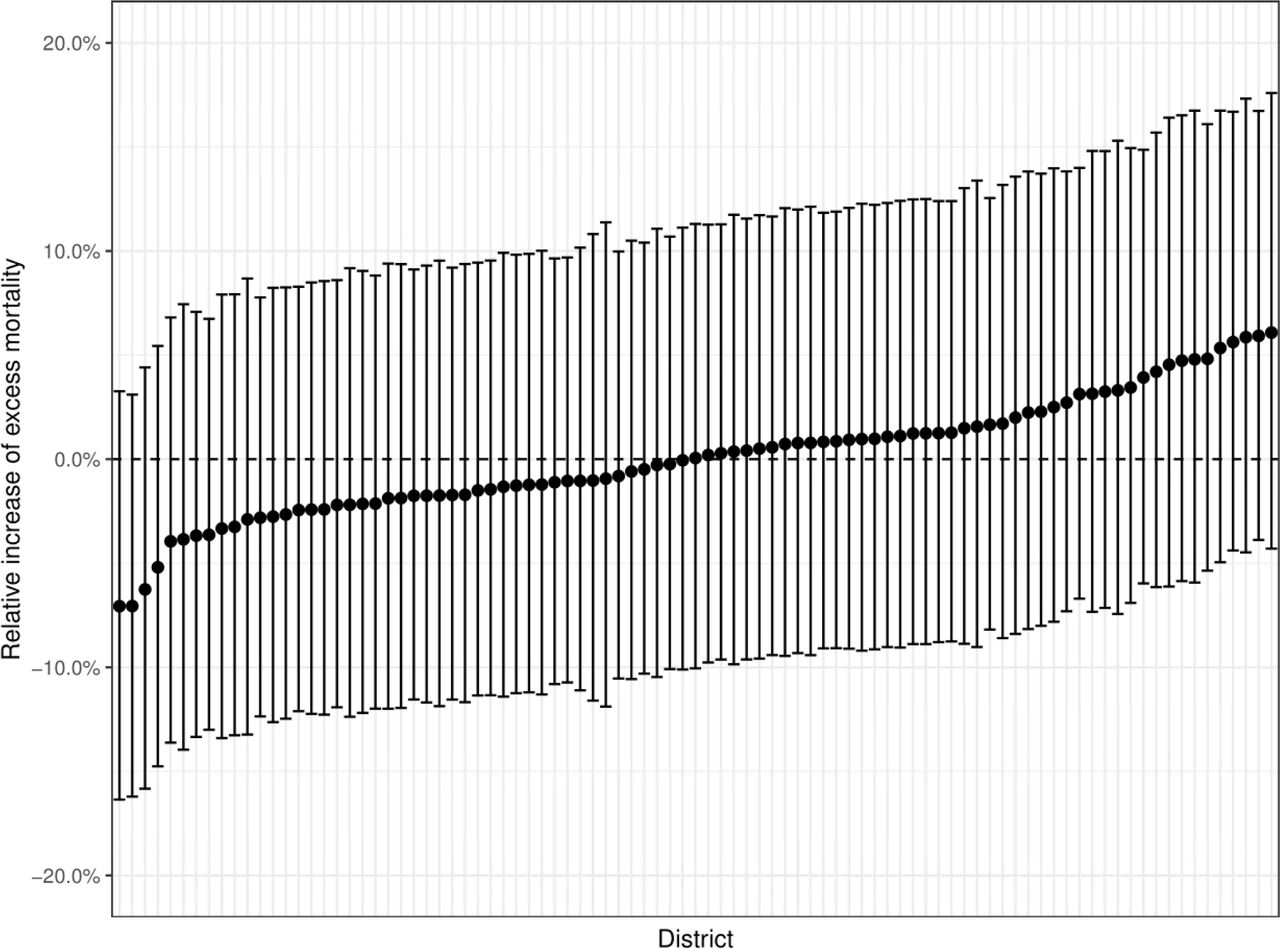
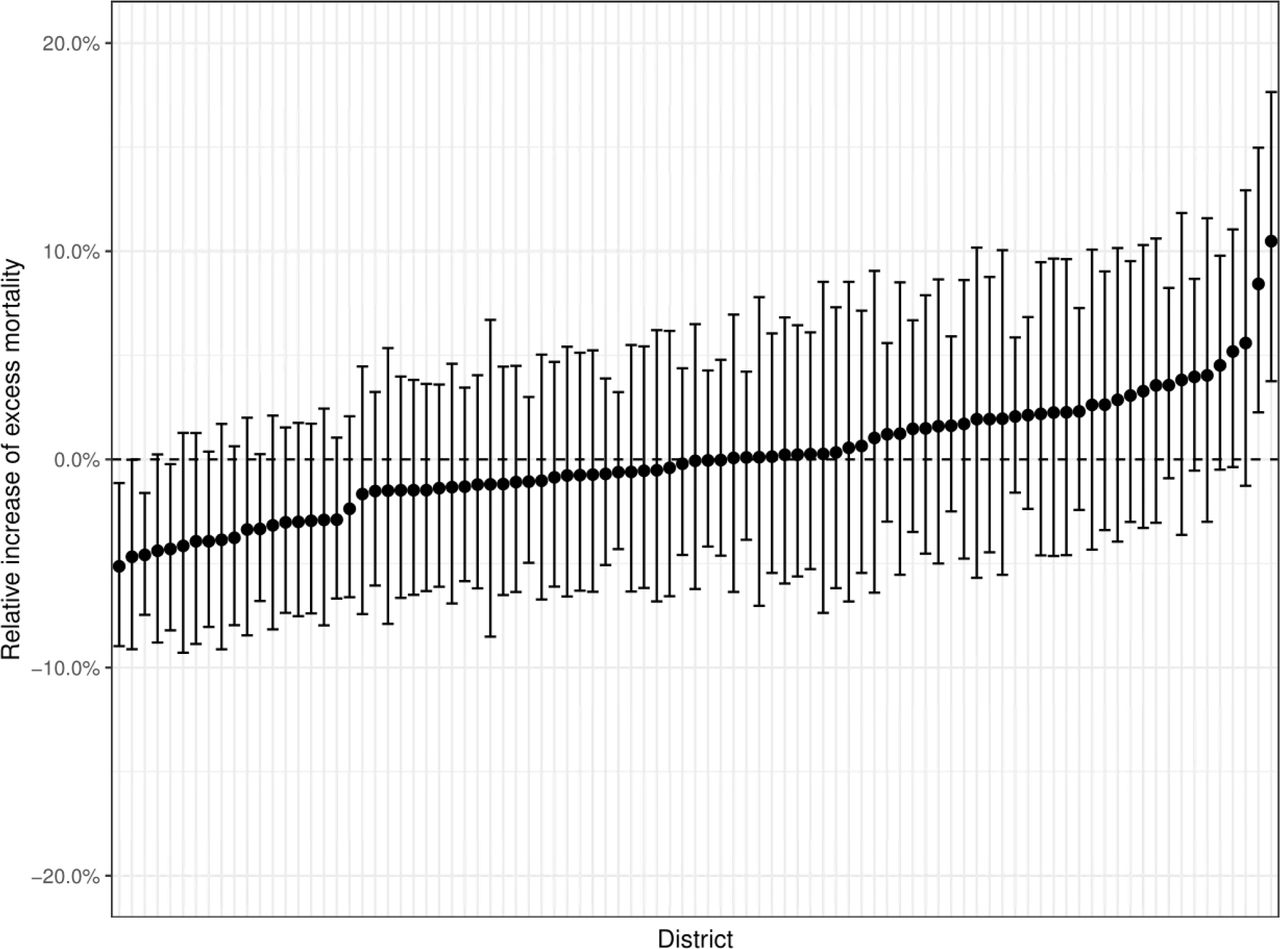
The district-specific random effects are presented in figures 1 and 2. All of the 95% CIs of the district-specific intercept effects (figure 1) included the null value, which means that, after adjusting for the other variables in the model, none of the districts differed in terms of overall excess mortality from the typical district (ie, the one with median effect on excess mortality). A slightly higher between-district heterogeneity emerged from the random effect on the coefficient of COVID-19 hospitalised patients. Six districts showed a coefficient significantly different from 0. In four, it was negative, meaning that the impact of the amount of COVID-19 hospitalisations (ie, the spread of the pandemic) on the excess mortality was lower than the average. Interestingly, three of these districts had a positive unadjusted excess mortality (5.28, 3.21 and 2.96). In other words, they experienced an epidemic wave intense enough to cause an increase in mortality compared with previous years, but this increase was less important than what it would have been if the same number of infected individuals had been observed in the average district. Two other districts showed a positive random effect on the coefficient of COVID-19 hospitalisations. In these districts, the increased number of infections caused an increase in mortality greater than expected, considering the average effect observed in the other districts.

Estimates of the district-specific random effect about the intercept reported as the district-specific increase of excess mortality as compared with the average district.

Estimates of the district-specific random effects about the coefficient of the number of COVID-19 hospitalisations reported as the district-specific increase of excess mortality for each additional hospitalised patient per 1000 residents as compared with the same increase in the average district.
The estimated smooth function of the quantitative variables through the GAM model did not provide evidence of a non-linear behaviour and the inspection of the residual plots did not raise concerns on violations of the model’s assumptions. The comparison of the negative binomial model with a simpler Poisson model confirmed the preliminary evidence of overdispersion in our data and, thus, the need for the negative binomial distribution for the response.
Discussion
Lombardy was the first area of the Western countries to be severely hit by the SARS-CoV-2 pandemic in 2020. This phenomenon, however, was by no means homogeneous in the regional territory, with districts only marginally affected and others critically hit by outbreaks over the year. As a result, when comparing the number of deaths between 2020 and 2015–2019, we observed high heterogeneity in mortality differences across the Lombardy districts, ranging from reductions of about 30% to more than 6-fold increases. Accordingly, the response of local public health and healthcare authorities was very different. While the activities of hospitals and community healthcare services were suddenly turned upside-down in some districts, others only dealt with minor preparedness actions.
In this context, the local, district-level response is the lowest of a three-level hierarchical structure of actions, where regional and national initiatives represent the two higher levels. The common, final goal of all actions put in place was to minimise the impact of the pandemic on patients and society, but also to limit the possible healthcare disparities among patients, after taking into account the heterogeneity of the spread of the virus on the territory. Indeed, safeguarding the rights of the citizens to health and medical care is one of the duties of public institutions, at least in the European Union.
Specifically, when confronted with a pandemic, the public commitment translates into minimising the risk of infection for the population and providing all infected individuals with the best healthcare. However, given the abrupt spread of SARS-CoV-2 during the first waves and the initial lack of knowledge about virus and caused disease, it was impossible to prevent the pandemic from evolving with very different intensities in different areas of the region in 2020. Hence, while public health institutions had minimal control over the heterogeneous spread of the virus across the region, they hold full responsibility for the quality and, specifically, the homogeneity of the healthcare provided to infected patients. Accordingly, we need to evaluate the variability of excess mortality in the territories under their jurisdiction to assess whether public health institutions successfully fulfilled at least their duty to limit the possible healthcare disparities among patients. We, therefore, compared the overall excess mortality across the various districts, controlling for indicators of the magnitude of the pandemic wave.
We developed a mixed-effect negative binomial regression model explaining the excess mortality observed in 2020 with period-level and district-level characteristics. The random effects modelled the between-district unobserved heterogeneity and were applied to the intercept and the variable measuring the wave magnitude, that is, the percentage of COVID-19 hospitalised patients. The random component on the intercept represents the heterogeneity of the districts in terms of the contribution to the excess mortality not related to the spread of COVID-19. By modelling the heterogeneity of such contribution, we were able to test whether districts differed in terms of the component of the excess mortality explained by the general situation and not by the number of COVID-19 cases. Similarly, the random component applied to the percentage of COVID-19 hospitalised patients represents the heterogeneity of the districts in terms of the excess mortality directly related to the spread of COVID-19.
Concerning the intercept, none of the district-related random effects was significantly different from zero. This means that in 2020 the excess mortality observed in Lombardy was entirely attributable to the surge of the pandemic. No other factor independently contributed to this phenomenon, and none of the districts behaved differently in this regard. On the other hand, as expected, we found a positive association between the number of COVID-19 hospitalised patients and excess mortality. The excess mortality increased by 15.5% for each additional hospitalised patient per 1000 inhabitants. Only 6 of the 91 regional districts (6.6%) presented a random effect significantly different from 0. Notably, when computing several independent 95% CIs, about 5% of them are expected to depart from the null value even under the null hypothesis. Therefore, there is very limited evidence supporting the existence of districts where the COVID-19-related excess mortality was truly different from the average. We conclude that the district of residence did not represent a source of discrimination in terms of survival chances, at a parity of COVID-19 spread.
This finding suggests that the inevitable differences in resilience capacity across districts did not generate health disparities over the region, possibly due to the actions undertaken by the regional government. As an example, the efforts of the Lombardy Agency for the Emergency System were precisely directed towards the management of the region as a whole, coordinating interhospital transfers and the transportation of high volumes of patients over the regional territory, even far from the emergency scene. Notably, this does not mean that the regional government undertook the best possible actions to minimise the impact of the pandemic. To address such a question, we should apply the same approach at the national level, thus comparing excess mortality of different regions, at a parity of COVID-19 spread.
An alternative explanation of the observed uniformity among districts could be the ineffectiveness of all the actions undertaken at the district level for the survival of the citizens. This hypothesis, however, conflicts with two considerations. First, the evidence about the efficacy of steroids became available very soon,37 well before the second wave of 2020. Second, the overall excess mortality, which is the focus of our study, was the result of both direct and indirect effects of the pandemic, with the latter effects being certainly sensitive to the actions that were put in place. These considerations make the hypothesis of non-responsiveness to all of the implemented actions extremely unlikely.
Besides the possibility of addressing the main objective of the study, our model offers further insights about the confounding variables that were considered as covariates. The association between excess mortality and calendar time, population density, proportion of old population and pro-capita GDP has been previously studied in the literature,27 28 although the choice of different adjusting variables and modelling techniques prevents the direct comparison of the results. To the best of our knowledge, no previous study has explored the role of mobility on excess mortality in Lombardy. Specifically looking at the estimates of our model, we found a significant independent impact on excess mortality of all time periods, except for P5 (resumption of activities, no lockdown). Such a variable was meant to measure possible time-dependent dynamics, not captured by the other covariates in the model. Remarkably, the relative risks associated with all the significant periods but P2 (first wave, hard lockdown) were around 1.1. Nonetheless, we can speculate that the relative risk of P2 was overestimated. During the first wave, the hospital laboratories did not have adequate resources to timely process the nasopharyngeal swabs of all suspected cases, and this scarcity of resources hindered the use of COVID-19 tests for contact tracing. In this context, the large number of unrecognised infections may have contributed to the underestimation of the independent effect of the variable ‘COVID-19 hospitalised patients’ on excess mortality in the early stages of the pandemic. We hypothesise that the coefficient of the P2 indicator absorbed such a lack of accuracy.
Overall, the time effects point towards a significant contribution to the excess mortality that was independent of the prevalence of the disease. Such an effect increased excess mortality by around 10%, with some uncertainty in the very first phase of the pandemic. It is tempting to think that this effect reflects the indirect impact of the pandemic, which involves people who were not affected by COVID-19 but suffered from the reorganisation of the healthcare system to cope with the new disease. This hypothesis would also explain the subsistence of the time effect after the wave waning.
All the other variables considered in the model did not significantly affect excess mortality. The homogeneity of the Lombardy districts in terms of age distribution may explain the lack of association between population age and excess mortality. On the other hand, while the relationship between average wealth of a population and outcomes is well established for chronic illnesses, the same relationship unlikely holds for acute diseases. Similarly, population density and mobility were not associated with excess mortality. Though we can expect both variables to significantly impact the spread of the disease, their lack of association with the survival of patients is not surprising. On the one hand, healthcare services are tailored to the population density. On the other hand, our mobility data referred to territorial units larger than districts, which may have diluted our ability to recognise any possible effect. Furthermore, because of its correlation with the considered time periods, the effect of population mobility may have partially been captured by the time variable.
While our findings are based on the Lombardy data and our results are limited to the districts of the region, the methodological framework described in this study can be generalised well beyond the regional and national borders. Future research can leverage our rigorous selection of confounders and apply our modelling approach to measure whether public health responses resulted in a heterogeneous mortality excess across geographical areas of interest.
Our study has limitations. First, we are aware of the constraints to administering COVID-19 tests in P2 caused by the lack of laboratory resources, which affected the number of infections and infection-related deaths in that period. While we partially addressed this issue by considering the number of hospitalised patients in our model, the lack of a reliable indicator of the disease prevalence leaves some uncertainty regarding the estimates of that period.
Second, with respect to the mobility data, since we could not obtain data from the previous year (2019), movements in the region were compared with the data registered during the first months of 2020, when SARS-CoV-2 was still absent, instead of relativising 2020 data to the corresponding period in 2019. Therefore, the adopted variable may have partially absorbed possible seasonal variations in regional mobility. Moreover, we only disposed of this data at a coarser granularity, that is, at the province level, while all the other variables were available at the district level.
Third, to compute the excess mortality in the healthcare districts, we compared the mortality observed in 2020 to the average of the historical mortality data from 2015 to 2019, which was considered as the mortality that could have been observed if the COVID-19 pandemic had not hit the Lombardy region. In contrast, other studies used sophisticated statistical models to estimate the 2020 expected mortality, both on international data21–23 and in the Italian context,25 26 accounting for other information such as annual trends and temperature data. While the average of historical data provides a rougher estimate of the expected mortality, this approach has been widely adopted by the ISTAT18 and Eurostat38 to estimate COVID-19-related excess mortality, as well as by other studies in the literature.24 27 28
Fourth, the developed model included district-specific random effects, thus accounting for the correlation of the observed excess mortality within healthcare districts over time. However, our model did not account for the possible correlation among nearby districts. Previous studies modelled the geographical structure of Italian municipalities25 or regions23 to explicitly introduce a higher correlation among the observed mortality excess in geographically closer areas. Because our analysis was performed at the district level, where individuals have access to the same healthcare facilities and social services, we expect the between-district correlation in excess mortality to be much smaller than what exists among lower-level geographical units, such as municipalities. Nonetheless, the sensitivity of our results to the introduction of spatial effects should be explored in future research.
Finally, it is important to note that the effect of the pandemic on the 2020 Lombardy population will likely go well beyond the year, for the postponement of non-COVID-19 non-urgent healthcare (visits, screenings and even interventions) and the unknown long-term effect of the disease. We only focused on the excess mortality during the different periods of 2020, thus limiting our analysis to the immediate increase in the number of deaths. Quantifying the overall burden of the disease is a challenge for future studies.
In summary, our study analysed the impact of COVID-19 on excess mortality over the year 2020 in the Lombardy region, the first territory of the Western countries to be severely hit by the pandemic. Our findings suggest a homogeneous relationship between the incidence of the disease and excess mortality across the 91 Lombardy districts, which can be interpreted as the result of successful actions to limit health disparities over the regional territory in a critical, unprecedented conditions.
Data availability statement
No data are available. We do not have the right to distribute the analysed data (owned and provided by the Lombardy Region).
Ethics statements
Patient consent for publication
Ethics approval
The project was approved by the ethics committee of the Fondazione IRCCS Istituto Neurologico 'Carlo Besta'. As authorised by the ethics committee, the retrospective study did not require informed consent, in compliance with Authorisation No. 9/2016—General Authorisation to Process Personal Data for Scientific Research Purposes.
Supplementary materials
Supplementary Data
This web only file has been produced by the BMJ Publishing Group from an electronic file supplied by the author(s) and has not been edited for content.
Footnotes
Contributors MP, GN, GC, FC, RC, SP, MM, AM and GB were responsible for the concept of the study. MP, GN and GB designed the study, wrote the first draft of the manuscript and revised it after the review of the wider study team. GB is the guarantor. MP, GN and CR carried out the statistical analysis for the study. GIG supported in preparing the paper for publication, including performing the literature search and drafting parts of the manuscript. All authors approved and decided to submit the paper for publication.
Funding This work is part of the TSUNAMI project, funded by Regione Lombardia with decree number 7082 issued on 17 June 2020. The authors also acknowledge support for the Article Processing Charges (APCs) from the University of Milan through the APC initiative.
Competing interests None declared.
Patient and public involvement Patients and/or the public were not involved in the design, or conduct, or reporting, or dissemination plans of this research.
Provenance and peer review Not commissioned; externally peer reviewed.
Supplemental material This content has been supplied by the author(s). It has not been vetted by BMJ Publishing Group Limited (BMJ) and may not have been peer-reviewed. Any opinions or recommendations discussed are solely those of the author(s) and are not endorsed by BMJ. BMJ disclaims all liability and responsibility arising from any reliance placed on the content. Where the content includes any translated material, BMJ does not warrant the accuracy and reliability of the translations (including but not limited to local regulations, clinical guidelines, terminology, drug names and drug dosages), and is not responsible for any error and/or omissions arising from translation and adaptation or otherwise.